Marki Microwave's Mixer Spurious Product Calculator App
|
|
Featured Product Archive The inventions and products featured on these pages were chosen either for their uniqueness in the RF engineering realm, or are simply awesome (or ridiculous) enough to warrant an appearance. | 1 | 2 | 3 | 4 | 5 | 6 | 7 | 8 | 9 | 10 | 11 | 12 | 13 | 14 | 15 | 16 | 17 | 18 | 19 | 20 | 21 |
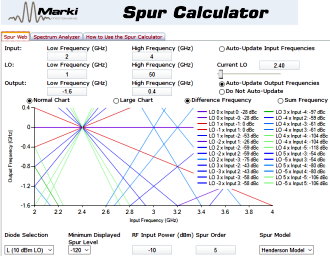
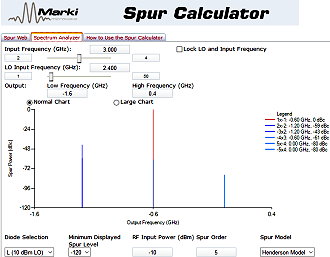
Hyperlinks all around the Internet pointing to Hittite's infamous Mixer Spurious Product Calculator broke suddenly when Analog Devices swallowed them up in 2014. For a while you could find it as the ADI Mixer-Spur Graphical Representation tool on the ADI website, but now it is gone, too, and even the WaybackMachine does not have a capture of it. However, Marki Microwave now has a much nicer Spur Calculator that you will want to consider. It provides both a "Spur Web" format and a "Spectrum Analyzer" format for presenting mixer spurious products. The interface is very user friendly both for the input and the output specification. The "Spur Web" screen uses a format pioneered by Collins Radio back in the middle of the last century that plots the RF/LO and IF/LO harmonics as straight lines, and then the user would draw a rectangle within them that represents the limits of the input and output frequency bands. Any spurious product lines that pass through the rectangle are inband at the output, and hence cannot be filtered out after the fact. Marki's presentation does not draw a rectangle anywhere, but instead uses the user-defined input and output lower and upper frequency limits to bracket the Spur Web lines within the entire chart area. The disadvantage to this approach is that if you use the actual receiver operational input and output bandwidths for the simulator specifications, you do not get an appreciation for which spurs might lie just outside of the operational band. When you analyze spurious mixer products using a range of frequencies wider than actual operational band, you have to mentally construct the rectangle which defines the operational input and output band within the chart.
BTW, as far as I know I was the first person to dub the chart format as a "Spur Web," and I also believe mine was the first time that Spur Web chart format had ever been implemented in software with a graphical user interface. Tx/Rx Designer was truly ground-breaking in its day. RF Workbench is included in many collections of engineering software, including the "Engineering 2000" CD.
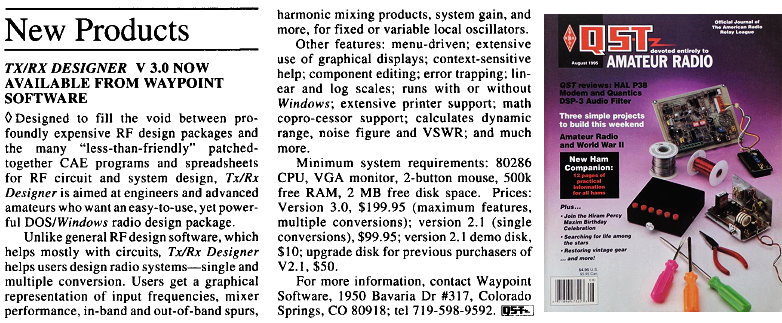
Here is an announcement for Tx/Rx Designer (the original for-sale name of the RF Workbench Shareware) in the August 1995 issue of the ARRL's QST magazine.
Posted December 1, 2017 |