|
<Previous
Next>
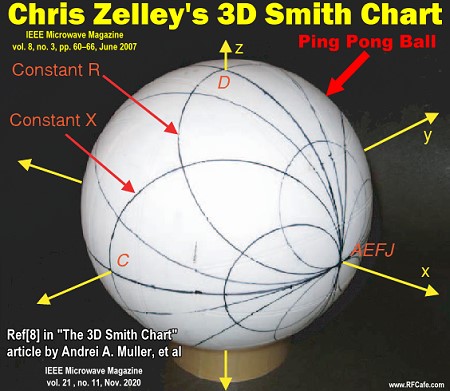
The world was introduced publicly in 2007 to the concept of a 3-dimensional Smith
chart by Chris Zelley. In article published in IEEE Microwave Magazine
entitled, "A
Spherical Representation of the Smith Chart," the radically new concept was
illustrated on the surface of a ping pong ball using a felt-tipped pen (thumbnail
at left). Inspired by the sight, Andrei A. Muller and a small team of developers
in 2013 created a version of the 3D Smith Chart in software using
the Java language that allows it to execute on any platform. In 2017, an expanded
functionality commercial version of
3D Smith Chart
was released at a very modest price. A number of articles have been published on
the topic extolling the unique ability of a 3-dimensional complex impedance volume
to expose properties not immediately apparent in a 2-dimensional plane. Recently,
Andrei A. Muller, Victor Asavei, Alin Moldoveanu, Esther Sanabria-Codesal, Riyaz
A. Khadar, Cornel Popescu, Dan Dascalu, and Adrian M. Ionescu published an article
entitled, "The 3D Smith Chart: From Theory to Experimental Reality"
(here is a public
access version). It is to date the most comprehensive and comprehendible
treatise on their creation. I repeat my prediction that at some point the 3D Smith
Chart will become the de facto standard integrated into professional grade simulation
packages.
As of April 2020, the 3D Smith Chart tool is free undergraduate, master or PhD
university students for academic projects! For the free trial version please contact
us via contact form or on
3dsmithchart@gmail.com
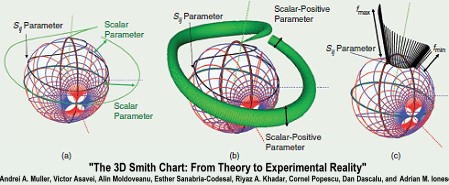
The 3D Smith Chart: From Theory to Experimental
Reality (an excerpt from the full article)
 "[...]In this article,
we start with several drawings of spherical Smith charts, proposed with the aim
of having a generalized chart that deals with both negative and positive resistance
circuits within a compact surface. Then, we introduce our suggested 3D Smith chart,
discussing its main equation from an inversive geometry perspective, for which Möbius
transformations are a simple type of transformation, mapping circles into circles
on a special sphere (called a Riemann sphere); doing so leads to mathematical completeness
and simplicity when dealing with negative resistance and infinity. "[...]In this article,
we start with several drawings of spherical Smith charts, proposed with the aim
of having a generalized chart that deals with both negative and positive resistance
circuits within a compact surface. Then, we introduce our suggested 3D Smith chart,
discussing its main equation from an inversive geometry perspective, for which Möbius
transformations are a simple type of transformation, mapping circles into circles
on a special sphere (called a Riemann sphere); doing so leads to mathematical completeness
and simplicity when dealing with negative resistance and infinity.
Based on this, the article takes the reader on a journey to a compact tool where
all negative and positive resistances are analyzed on a preserving-circles patterned
sphere. We propose to use the 3D space surrounding the sphere for multiple-complex-
scalar visualization, which is useful in equivalent-circuit extractions and multiparameter
optimization or simply for multiple-variable imaging and uncovering changes in frequency
orientation[...]
 [...]The Smith chart is limited within the unit
circle to passive circuits with positive resistance (r) [or conductance (g)]; circuits
with negative r (or g), which occurs in active circuits, are not covered by the
conventional Smith chart. [...]The Smith chart is limited within the unit
circle to passive circuits with positive resistance (r) [or conductance (g)]; circuits
with negative r (or g), which occurs in active circuits, are not covered by the
conventional Smith chart.
In 2006, IEEE Microwave Magazine presented an article on drawings by the artist
M.C. Escher, including a spherical self-portrait. The article pointed out the connection
between the drawings of Escher and hyperbolic geometry while also emphasizing the
connection between the Smith chart and Möbius transformations in geometry within
the 2D complex plane.
Motivated by the desire to have a unified chart for both active and passive microwave
circuits, Zelley proposed drawing an intuitive spherical Smith chart on
a ping-pong ball. The drawing[...]still lacked 'mathematical rigor,' as
the author acknowledged, and no equations were given for its construction.
Inspired by the beautiful drawing[...]obtained by means of skillful but complicated
arithmetical and trigonometrical manipulations-spherical Smith chart theories were
proposed[...] [...]the circles appearing in 2D are mapped into different curves
on the spherical chart[...]
Please go to the IEEE website for access to the full article:
The 3D Smith Chart: From Theory to Experimental Reality
(login required)
* Here is a copy that does not contain IEEE edits and is
publically
accessible (no login).
Posted October 13, 2020
|


 "
"