Measuring Peak and Pulse Power with USB Power Sensorsby LadyBug Technologies |
|
White Papers
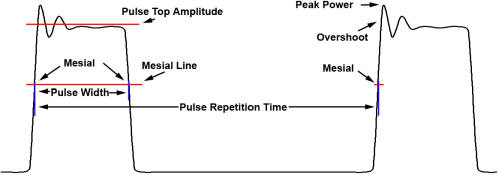
You are welcome to submit yours. As technology and measuring techniques advance, the time eventually comes when continuing to use old methods not only doesn't make sense, but can actually harm your reputation by providing data that cannot be duplicated by customers who long ago adopted the new ways. Orwill Hawkins, of LadyBug Technologies, has written a white paper describing how to make accurate, repeatable peak and pulse power measurements on waveforms using the precision of modern instruments that provide a graphical view of the entity being investigated. USB power meters provide an inexpensive means of obtaining high quality measurements and the benefits of a graphical display environment (on your computer) at a relatively low cost. I particularly like the use of the word 'mesial' in describing the midpoint of a pulse's rising and falling edges. October 2013 Application Note Measuring Peak and Pulse Power with USB Power Sensors By Orwill Hawkins LadyBug Technologies, LLC Advances in computing and measurement technology have increased the capabilities of USB RF Power Sensors. These advances have made measurement capabilities possible at modest costs that were previously out of reach. Capabilities like direct measurement of pulse power can now be done with low cost USB power sensors, such as those used in the example below. This paper will compare Pulse Power measurement using new, accurate USB Sensor technology to traditional measurement methods. Traditionally, Microwave Pulse Power has been measured using average power and applying the pulse's duty cycle using the long time accepted formula: Pulse Power = Average Power / Duty Cycle. This method uses total measured power over time and produces a computed Pulse Power result based on assumed pulse information. Unfortunately, additional information such as peak power, droop, and crest factor may remain unknown, rendering the measurement limited in value. Significant errors are also possible with this method due to errors in the assumed pulse width and duty cycle. Errors caused by discrepancies between actual and assumed pulse shape or malfunctioning equipment may also occur. Given the rapid advances in modulation technology, it is important to recognize the need for the additional information and accuracy that is now available with today's Power Sensor technology. Modern USB Power Sensors utilize cutting-edge processing technology and are capable of rapidly measuring and digitizing the demodulated waveform. These sensors integrate the measurement data over time and provide the user with actual pulse power, and provide additional measured parameters such as peak power, crest factor and duty cycle, in addition to average power. This information is often very useful for the engineer, designer and technician. Figure 1 depicts a microwave pulse stream and indicates some of the desirable information that can be measured with a USB Power Sensor.
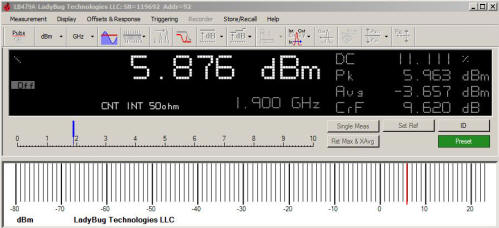
Figure 1 - Pulse Waveform Detail To deliver the necessary measurements, USB Peak and Pulse sensors use advanced trigger schemes that accurately locate the pulse mesials and process the digitized data from the measured power. These sensors provide accurate Peak Power, Pulse Width, Pulse Power, Pulse Repetition Rate, Duty Cycle, Crest Factor and more. As an alternative, some USB sensors, such as the LadyBug LB480A PowerSensor+™ that was used in the example below, support external triggering. This allows control of the measurement timing and can be particularly useful with very low power measurements where the signal might be near the noise floor. Averaging repetitive signals improves measurement accuracy. Pulse Power Example For example purposes, pulse power was measured from a small test source. The pulse modulating waveform has an 11 microsecond pulse width and a pulse repetition time of 100 microseconds. The Pulse carrier frequency is 1.9 GHz, and the on/off ratio for the test signal is better than 80 dB. Pulse power is just under 6 dBm. The test source was connected directly to the LadyBug LB479A Peak, Pulse and Average Sensor. The LB479A operates from 10 MHz to 8 GHz and over a dynamic range of - 60 dBm to +20 dBm. A screen shot of the measurement is shown in Image 1. All of these measurements were made simply by connecting the sensor to the signal source and entering the carrier frequency. This greatly simplifies and speeds up the measurement process weather it is in a bench, ATE, or service environment.
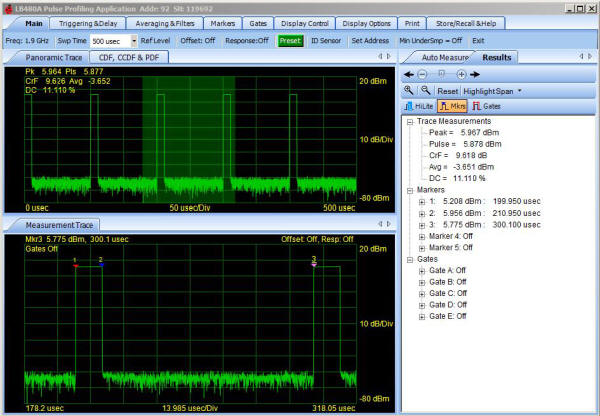
Image 1 - Power Measured with a LadyBug LB479A Analyzing the Results The traditional method requires the user to know the signal's Duty Cycle in order to calculate Pulse Power. Because Average only Sensors are not capable of measuring Duty Cycle, it must be calculated using the formula below. In many cases the Duty Cycle is given or assumed, not measured, adding suspicion to the measurements accuracy. In this case the Duty Cycle is given as 11.0% Duty Cycle=Pulse Width / Pulse Repetition Rate. Calculated Duty Cycle is 11% (=11 us/100 us) Note that the calculated 11% Duty Cycle is close to the 11.1% actual Duty Cycle measured by the sensor. This method can lead to other inaccuracies in the measurement caused by errors in the assumed pulse parameters, amplifier or modulator distortion, failing components etc. The sensor measured -3.657 dBm average power. Prior to applying the traditional method of determining Pulse Power, the measured average power must be converted from dBm to a linear scale, in this case mW. The following equation was used: P mW=10^(PdBm/10) = 10^(-3.657/10) = 0.431 mW. Now that linear power and Duty Cycle are known, Pulse Power can be calculated using the standard traditional formula: Pulse Power = Average Power / Duty Cycle as mentioned earlier. Plugging in the numbers results in a pulse power of 3.92 mW or 0.431 mW/0.11. This can now be converted back to dBm using PdBm=10*log10(PmW) The result is 5.933 dBm, and is very close to the more precisely measured 5.879 dBm. For further comparison, the Sensor was replaced with a LadyBug LB480A with pulse profiling time domain analysis capability as shown in Image 2.
Image 2 - Pulse Profile Measurement Zoom was utilized to expand the data and three markers were placed to determine the pulse width and repetition rate. Start time is shown by Marker #1 at 199.950 us, Marker #2 marks the pulse's end time at 210.950 us, and Marker #3 marks the end of the cycle at 311.100 us. The results visually and mathematically confirm previous measurements. Conclusion USB Peak, Pulse and Average Power Sensors, provide a lot of the valuable information that a Time Domain, Pulse Profiling sensor provides, at less cost. These sensors accurately measure Peak, Pulse & Average Power plus Duty Cycle along with analysis such as Crest Factor. The Sensors can expose unexpected system faults that cannot be found using an Average Power Sensor. These facts make them a very good alternative to traditional methods that utilize average only Sensors and combine the readings with the assumed pulse parameters. Today's modern Peak, Pulse and Average Power Sensors such as the LadyBug Technologies LB479A that was used in the example above, are cost competitive solutions for RF engineers and technicians. Contact Info Orwill Hawkins LadyBug Technologies, LLC Contact Phone: 707-546-1050 x103 Website: www.LadyBug-Tech.com e-Mail: Orwill@LadyBug-Tech.com
Posted October 24, 2013 |