Module 21 - Test Methods and Practices |
||||||||||||||||||||||||||||||||||||||||||||||||||
|
Module 21 − Test Methods and Practices
Pages i , 1−1, 1−11, 1−21, 2−1, 2−11, 2−21, 2−31, 2−41, 3−1, 3−11, 3−21, 3−31, 4−1, 4−11, 5−1, 5−11, 5−21, 5−31, AI−1 to AI−3, Index
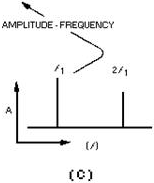
Figure 5-8C. - Time versus frequencies.
Frequency-DOMAIN DIsPLAY CAPABILITIES
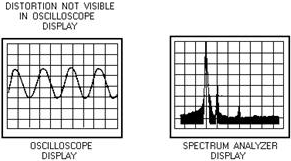
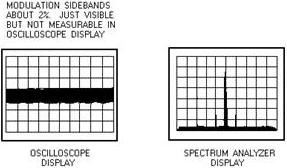
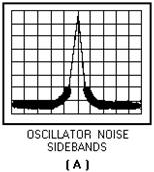
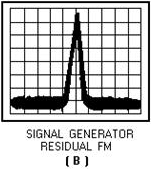
The frequency domain contains information not found in the time domain. The spectrum analyzer can display signals composed of more than one frequency (complex signals). It can also discriminate between the components of the signal and measure the power level at each one. It is more sensitive to low-level distortion than an oscilloscope. Its sensitivity and wide, dynamic range are also useful for measuring low-level modulation, as illustrated in views a and B of figure 5-9. The spectrum analyzer is useful in the measurement of long- and short-term stability such as noise sidebands of an oscillator, residual fm of a signal generator, or frequency drift of a device during warm-up, as shown in views A, B, and C of figure 5-10.
Figure 5-9A. - Examples of time-domain (left) and frequency-domain (right) low-level signals.
5-11
Figure 5-9B. - Examples of time-domain (left) and frequency-domain (right) low-level signals.
Figure 5-10A. - Spectrum analyzer stability measurements.
5-12
Figure 5-10B. - Spectrum analyzer stability measurements.
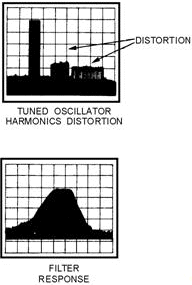
Figure 5-10C. - Spectrum analyzer stability measurements. The swept-frequency response of a filter or amplifier and the swept-distortion measurement of a tuned oscillator are also measurable with the aid of a spectrum analyzer. However, in The Course of these measurements, a variable persistence display or an X-Y recorder should be used to simplify readability. Examples of tuned-oscillator harmonics and filter response are illustrated in figure 5-11. Frequency- conversion devices such as mixers and harmonic generators are easily characterized by such parameters as conversion loss, isolation, and distortion. These parameters can be displayed, as shown in figure 5-12, with the aid of a spectrum analyzer.
5-13
Figure 5-11. - Swept-distortion and response characteristics.
Figure 5-12. - Frequency-conversion characteristics.
5-14 Present-day spectrum analyzers can measure segments of the frequency spectra from 0 hertz to as high as 300 gigahertz when used with waveguide mixers.
SPECTRUM ANALYZER Applications
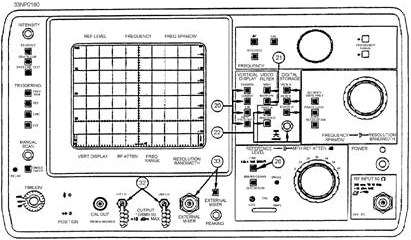
Figure 5-13 shows a typical spectrum analyzer. The previously mentioned measurement capabilities can be seen with a spectrum analyzer. However, you will find that the spectrum analyzer generally is used to measure spectral purity of multiplex signals, percentage of modulation of AM signals, and modulation characteristics of fm and pulse-modulated signals. The spectrum analyzer is also used to interpret the displayed spectra of pulsed RF emitted from a radar transmitter.
Figure 5-13. - Typical spectrum analyzer.
COMPLEX WAVEforMS
Complex waveforms are divided into two groups, PERIODIC WAVES and NONPERIODIC WAVES. Periodic waves contain the fundamental frequency and its related harmonics. Nonperiodic waves contain a continuous band of frequencies resulting from the repetition period of the fundamental frequency approaching infinity and thereby creating a continuous frequency spectrum.
MODULATION MEASUREMENTS
In all types of modulation, the carrier is varied in proportion to the instantaneous variations of the modulating waveform. The two basic properties of the carrier available for modulation are the Amplitude Characteristic and ANGULAR (frequency or phase) Characteristic.
Amplitude Modulation
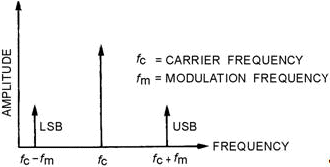
The modulation energy in an amplitude-modulated wave is contained entirely within the sidebands. Amplitude modulation of a sinusoidal carrier by another sine wave would be displayed as shown in figure 5-14. For 100% modulation, the total sideband power would be one-half of the carrier power; therefore,
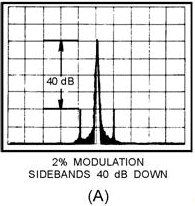
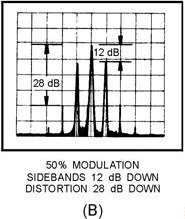
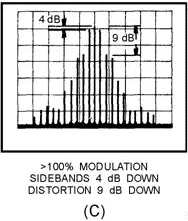
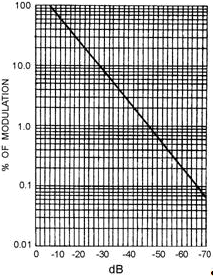
5-15 each sideband would be 6 dB less than the carrier, or one-fourth of the power of the carrier. Since the carrier component is not changed with AM transmission, the total power in the 100-percent-modulated wave is 50% higher than in the unmodulated carrier. The primary advantage of the log display that is provided by the spectrum analyzer over the linear display provided by the oscilloscopes for percentage of modulation measurements is that the high dynamic range of the spectrum analyzer (up to 70 dB) allows accurate measurements of values as low as 0.06%. It also allows the measurements of low-level distortion of AM signals. Both capabilities are illustrated in figure 5-15, view A, view B, and view C. The chart in figure 5-16 provides an easy conversion of dB down from carrier into percentage of modulation.
Figure 5-14. - Spectrum analyzer display of an AM signal.
Figure 5-15A. - Spectrum analyzer displays of AM signals.
5-16
Figure 5-15B. - Spectrum analyzer displays of AM signals.
Figure 5-15C. - Spectrum analyzer displays of AM signals.
5-17
Figure 5-16. - Modulation percentage versus sideband levels.
Note: Anything greater than -6 dB exceeds 100% modulation and produces distortion, as shown in figure 5-16.
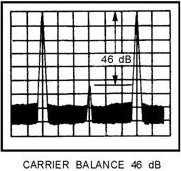
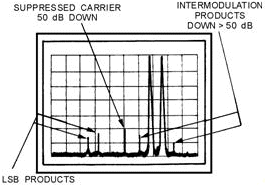
In modern, long-range HF communications, the most important form of amplitude modulation is SSB (single-sideband). In SSB either the upper or lower sideband is transmitted, and the carrier is suppressed. SSB requires only one-sixth of the output power required by AM to transmit an equal amount of intelligence power and less than half the bandwidth. Figure 5-17 shows the effects of balancing the carrier of an AM signal. The most common distortion experienced in SSB is intermodulation distortion, which is caused by nonlinear mixing of intelligence signals. The two-tone test is used to determine if any intermodulation distortion exists. Figure 5-18 illustrates the spectrum analyzer display of the two-tone test with the modulation applied to the upper sideband input.
Figure 5-17. - Double sideband carrier suppressed.
5-18
Figure 5-18. - Two-tone test.
Q-5. What is the advantage of single-sideband (SSB) transmission over AM transmission?
Frequency Modulation
In frequency modulation, the instantaneous frequency of the radio-frequency wave varies with the modulation signal. As mentioned in NEETS, module 12, the amplitude is kept constant. The number of times per second that the instantaneous frequency varies from the average (carrier frequency) is controlled by the frequency of the modulating signal. The amount by which the frequency departs from the average is controlled by the amplitude of the modulating signal. This variation is referred to as the Frequency DEVIATION of the frequency-modulated wave. We can now establish two clear-cut rules for frequency deviation rate and amplitude in frequency modulation:
· Amount of frequency shift is proportional to the amplitude of the modulating signal.
(This rule simply means that if a 10-volt signal causes a frequency shift of 20 kilohertz, then a 20- volt signal will cause a frequency shift of 40 kilohertz.)
(This second rule means that if the carrier is modulated with a 1-kilohertz tone, then the carrier is changing frequency 1,000 times each second.)
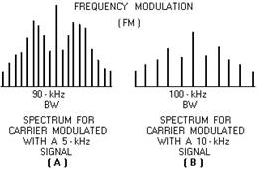
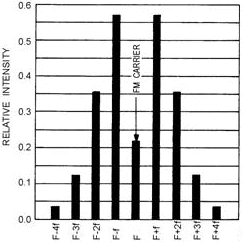
The amplitude and frequency of the signal used to modulate the carrier will determine both the number of significant sidebands (shown in fig. 5-19) and the amplitude of the sidebands (shown in fig. 5- 20). Both the number of significant sidebands and the bandwidth increase as the frequency of the modulating signal increases.
5-19
Figure 5-19. - Distribution of sidebands.
Figure 5-20. - Spectrum distribution for a modulation index of 2.
NEETS, module 12, should be consulted for an in-depth discussion of frequency-modulation principles.
Q-6. What happens to an fm signal as you increase the frequency of the modulating signal?
PULSED WAVES
An ideal pulsed radar signal is made up of a train of RF pulses with a constant repetition rate, constant pulse width and shape, and constant amplitude. To receive the energy reflected from a target, the radar receiver requires almost ideal pulse radar emission characteristics. By observing the spectra of a pulsed radar signal, you can easily and accurately measure such characteristics as pulse width, duty cycle, and
5-20
|
||||||||||||||||||||||||||||||||||||||||||||||||||
