|
May 1969 Electronics World
 Table of Contents
Wax nostalgic about and learn from the history of early electronics. See articles
from
Electronics World, published May 1959
- December 1971. All copyrights hereby acknowledged.
|
 Simmonds Precision Products (bought by
Goodrich), a company in Vergennes, Vermont, which I worked for for
a couple years prior to quitting to attend the University of Vermont full-time to finish
my electrical engineering degree, had as one of their main products capacitance-based
fuel measurement systems for military and commercial aircraft. As was common in the era
(up through the late 1980s), they made not only the capacitance probes and associated
electronics, but also the cockpit displays and power supplies. Being a test technician
at the time, I got a pretty good exposure to the complexities of such a fundamentally
simple principle as using the dielectric constant of the fuel to vary the capacitance
between a set of plates. Capacitance probes were located at strategic points inside the
fuel tank such
that, combined with other flight parameter data (pitch, roll, yaw, acceleration, etc.),
yielded an accurate [enough] indication of the fuel quantity. The cockpit displays were
transitioning from a mechanical indicator to LCDs, which were very new and very expensive.
I got to use a photometer setup for the first time to measure brightness and contrast,
and also the first ESD protection test setup to validate immunity to static discharges
of the display. Much of the test equipment was custom designed in-house as well (not
the photometer). Simmonds Precision Products (bought by
Goodrich), a company in Vergennes, Vermont, which I worked for for
a couple years prior to quitting to attend the University of Vermont full-time to finish
my electrical engineering degree, had as one of their main products capacitance-based
fuel measurement systems for military and commercial aircraft. As was common in the era
(up through the late 1980s), they made not only the capacitance probes and associated
electronics, but also the cockpit displays and power supplies. Being a test technician
at the time, I got a pretty good exposure to the complexities of such a fundamentally
simple principle as using the dielectric constant of the fuel to vary the capacitance
between a set of plates. Capacitance probes were located at strategic points inside the
fuel tank such
that, combined with other flight parameter data (pitch, roll, yaw, acceleration, etc.),
yielded an accurate [enough] indication of the fuel quantity. The cockpit displays were
transitioning from a mechanical indicator to LCDs, which were very new and very expensive.
I got to use a photometer setup for the first time to measure brightness and contrast,
and also the first ESD protection test setup to validate immunity to static discharges
of the display. Much of the test equipment was custom designed in-house as well (not
the photometer).
Capacitance Probes in Industrial Instrumentation -
By Ray A. Shiver / AiResearch Mfg. Co.
Super-precision tolerances required in making and testing today's planes and space
vehicles are checked with these probes. These techniques are described.
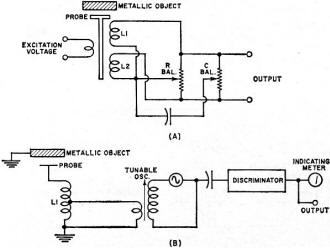
Fig. 1 - (A) Differential-transformer and (B) FM capacitance-probe
methods have the disadvantage of temperature problems.
Today's aircraft and space industry requires super-precision tolerances in the manufacture
and testing of components. This applies to dynamic testing and balancing, as well as
precise static measurements. Dynamic measurements require that readings be taken while
the test specimen is in motion, such as shaft balancing on an engine or displacement
readings on a vibrating member. Static measurements involve setting precise distances
between two members which are stationary at the time of installation or adjustment.
Today's instruments can accurately measure distances as small as 50 microinches. Included
in this article is a description of one such system that is capable of producing excellent
accuracies within the range 0.00005 to 0.5 inch.
Several methods have been employed for measuring distance (or proximity) and each
will be discussed briefly.
Differential-Transformer System
The setup illustrating a variable-reluctance differential-transformer system is shown
in Fig. 1A. An a.c. voltage is applied to the excitation coil as indicated. The two secondary
coils, L1 and L2, are connected so that they are 180° out-of-phase and no voltage
is present at the output terminals. The resistive and capacitive balance is necessary
to cancel out small differences in the inductance of L1 and L2 and to provide a means
of adjusting for zero output voltage at various positions of the metallic object in relation
to the differential transformer probe (core).
The system is first balanced with the metal object in some rest position. Any movement
away from this position will change the inductance of L1 with respect to L2 and an unbalance
voltage will be present at the output terminals which is proportional to the distance
traveled. Thus, such a system is useful for measurements involving vibration and displacement.
There are two disadvantages of such a system. First, the operating range, in order
to be linear, is necessarily limited to a few mils (thousandths of an inch) and, second,
the accuracy suffers markedly with any change in temperature at the probe location. This
shows up very noticeably as a shift in the original balance position and a loss of the
zero reference point. The variable-reluctance system produces very good results over
a limited operating range if the temperature at the measuring location remains constant.
FM Capacitance-Probe System
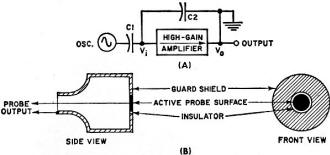
Fig. 2 - (A) Feedback-loop capacitance-probe system produces output
inversely proportional to C2. (B) Probe construction.
A system employing a tunable oscillator, discriminator, and tuned pickup coil is shown
in Fig. 1B. The operation of such a system is as follows: With the metallic object at
some rest position, the oscillator is tuned to the discriminator frequency, producing
a zero output voltage. Any movement of the object away from the original position produces
a capacitance change across L1, thereby causing the oscillator frequency to shift a proportional
amount. The discriminator circuit in the measuring instrument produces a corresponding
output voltage. Usually included with such an instrument are a meter that can be calibrated
directly and an analog d.c. output voltage for use by recording devices or other measuring
instruments.
This system for measuring distance is capable of good operating range and frequency
response. However, it suffers one drawback that is common to the first system in that
it is quite temperature sensitive.
Feedback-Loop Capacitance-Probe System
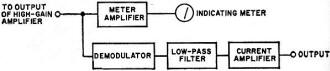
Fig. 3 - Additional circuits needed for distance measurements.
This method overcomes the temperature problem associated with the first two systems.
Fig. 2A illustrates the basic circuitry for an inverse-feedback capacitance-probe system.
The voltage from a high-frequency oscillator (usually 50-100 kHz) is fed to the input
of a high-gain amplifier. The output voltage, Vo, is 180° out-of-phase
with the input voltage, Vi, and is coupled to the amplifier input through
C2, which completes the feedback loop. This capacitor represents the remotely located
probe and test structure, with one plate the capacitance probe and the other the metallic
test specimen. The amplifier output voltage is inversely proportional to the capacitance
of C2 (capacitance between probe and test structure ). Hence, a voltage, Vo,
is produced whose amplitude is directly proportional to any change in distance between
the probe and test structure.
Fig. 2B shows the construction of a typical capacitance probe used with a feedback-loop
measuring system. The cross-section shows the button (active probe surface), insulator,
guard shield, and body of the probe. The center button is connected through a shielded
cable to the high side of the amplifier input. The guard shield effectively eliminates
any stray capacitance pickup at the sides of the probe and confines the active surface
to the front of the center button. The test structure and one side of the amplifier output
are connected to ground through a separate ground-return line.
Distance & Vibration Measurements

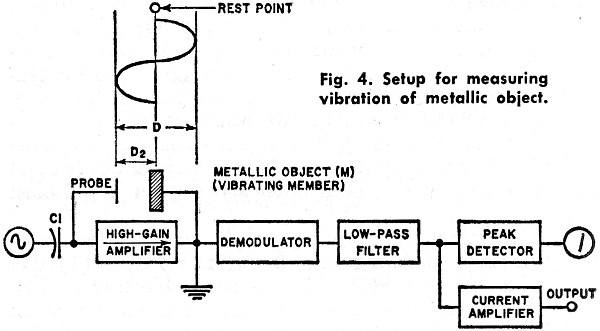
Fig. 4 - Setup for measuring vibration of metallic object.
The additional electronics needed to condition the amplifier output signal for distance
measurement is shown in the block diagram of Fig. 3. This consists of a meter amplifier
and indicating meter, a demodulator, low-pass filter, and a current amplifier. The latter
is used to provide a d.c. analog voltage, at low source impedance, for recording instruments,
As the distance between the capacitance probe and the metallic surface decreases,
the output voltage at the standard oscillator frequency increases correspondingly. If
the test structure is undergoing motion, such as a rotating cam or shaft, the standard
signal will be amplitude-modulated by this action. The signal is then demodulated, fed
through the low-pass filter, and appears at the output of the current amplifier. The
low-pass filter removes any vestiges of the oscillator standard frequency. The resulting
output signal may be displayed on an oscilloscope or recorded on a suitable instrument,
Vibration is measured by the capacitance-probe system, as shown in Fig. 4. The vibrating
member (M) begins at a rest point and oscillates through a total distance (D), producing
a peak-to-peak sinusoidal wave as shown in the diagram. The signal is then fed to the
demodulator as indicated. A rectified signal whose amplitude is directly proportional
to the displacement we wish to measure (D2) is produced at the demodulator output.
The signal is then amplified by the current amplifier where it may be displayed on
an oscilloscope or used to drive suitable recording devices. If an indicating meter is
used, a suitable peak-detecting circuit is employed. The damping characteristics are
such that the meter indicates true displacement (D2) between the capacitance probe and
the vibrating member.
It is often desirable to express vibration in terms of acceleration (G forces). This
is especially true when the frequency of the vibrating structure encompasses a moderately
wide range.
A setup that will readily determine the G forces present makes use of a scope and
a digital frequency counter. The signal from the distance meter is connected to the X-axis
of the scope. A variable-frequency oscillator covering the appropriate range to be measured
is connected to the Y-axis. The frequency counter monitors the oscillator output. In
order to determine the frequency of the vibrating structure, the oscillator frequency
is varied until a stationary circular Lissajous pattern is produced on the screen. At
this point, the oscillator frequency equals that of the vibrating structure and may be
conveniently read on the digital frequency meter. With the frequency and displacement
of the vibrating structure known, the G forces may be calculated using the formula: G
= 0.0511Df2 where G = units of gravity (386 in/s2), D = displacement
(p-p amplitude in inches), and f = vibration frequency in hertz.
As a practical matter, hand calculators are available to derive this data, which eliminates
the need for pencil and paper computations.
Typical Instrumentation Setup
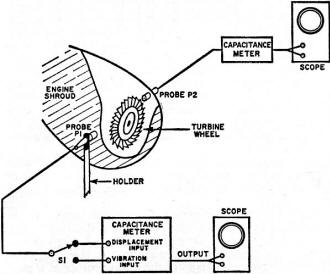
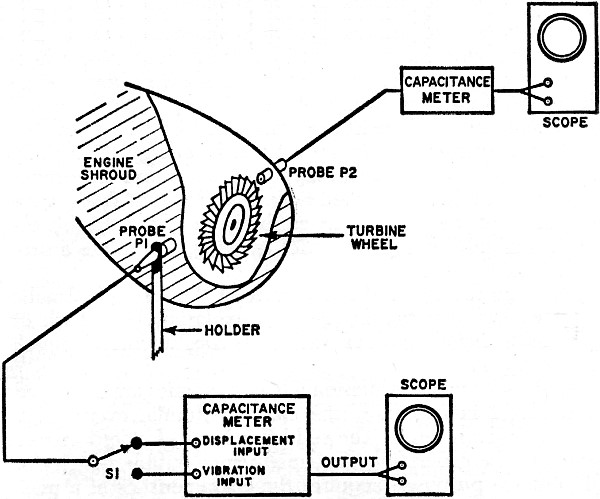
Fig. 5 - Typical setup for static and dynamic measurements.
Fig. 5 is a typical setup for both static and dynamic measurements, using capacitance
probes. The cutaway drawing shows two capacitance probes mounted in such a manner as
to read vibration, displacement, and thermal stress on a gas turbine engine. Probe P1
is mounted on a stationary member independent of the engine. Probe P2 is mounted on the
engine shroud itself in such a manner that it sees the tips of the blades on the turbine
wheel.
In order to insure accurate data from the measuring probes it is necessary to provide
an external calibration system for the operating range desired. To accomplish this, several
calibration points must be provided between P1 and the turbine shroud, and P2 with relation
to the wheel blade tips.
The probes must first be loosened in their mounts so that there is sufficient freedom
of movement for calibration purposes. Calibration blocks (similar to automobile feeler
gages) are used to set the precise distances needed for calibration.
Probe P1 would be calibrated in the following manner, assuming a d.c.-coupled oscilloscope
is used as the readout device, as shown in Fig. 5. The scope is first balanced for d.c.
usage (no deflection of the beam when the input gain is changed) and then the output
of the capacitance meter is connected. A calibration block 200-mils thick is inserted
between the engine shroud and the probe face. The probe mount is now tightened and the
calibration block removed. The oscilloscope trace is placed on a conventional horizontal
reference line using the beam-position control.
Again the probe mount is loosened and a 210-mil calibration block inserted between
the probe and the shroud. The probe mount is again tightened and the block removed. Assuming
we wish to calibrate the scope for 2 mils per division, we would set the input gain until
the trace moves up by 5 divisions. This procedure is repeated several times until good
repeatability is obtained.
After the calibration process is completed, the probe is placed at a convenient point
from the shroud, at a distance not exceeding the linear operating range of the particular
probe used. For small operating ranges (10-100 mils), feeler gages can be used for this
purpose. Once this distance has been determined, the probe holder is tightened and the
scope trace positioned on the reference line. The system is now ready for use.
Probe P2 is calibrated in much the same manner except an inside micrometer is used
to set probe distances since the tip of the probe is not readily accessible.
Some possible test objectives for the example in Fig 5 would include: From probe P1
obtain the maximum vibration point in both displacement and G forces. Also from P1 obtain
the maximum thermal growth of the shroud (expansion due to increased temperature). From
probe P2 obtain the minimum clearance between the blade tips of the turbine wheel and
the shroud.
The tests would be run in the following manner. Switch S1 would be placed on the vibration
input to the capacitance meter, since no thermal stress information would be needed until
the unit had reached maximum operating temperature.
The engine is started and slowly accelerated to operating speed. Normally there will
be one or more shaft criticals (resonant points exhibiting high vibration) during the
accelerating period. Once these points are located, the engine can usually be operated
at each critical long enough to obtain data from the CRO or indicating meters on the
capacitance-probe unit.
As an example, a maximum vibration reading may occur at 70 Hz. The displacement could
be read directly from the CRO screen or the capacitance meter. It could also be converted
directly into G forces in the manner outlined previously.
Also at the maximum vibration point the minimum blade tip-to-shroud clearance would
probably occur. This could also be determined from the CRO or indicating meter located
on the capacitance-probe unit.
In order to measure the maximum shroud growth due to a build up in temperature it
would be necessary to operate the engine until conditions had stabilized. This point
can be determined by a temperature-sensing device (thermocouple or similar probe) located
near the point where thermal stress is being measured. By this means the operator is
able to determine when the temperature has reached its maximum value. At this point,
S1 is placed in the displacement position and the CRO input is switched to d.c. In this
manner the d.c. voltage change will be indicated by a shift in the beam position directly
proportional to any growth of the shroud due to the effects of temperature.
These few examples, while somewhat simplified, should serve to indicate the versatility
of capacitance probes for both static and dynamic measurements, as used in industrial
instrumentation.
Posted January 1, 2018
|