Thermoluminescence Theory & Applications
|
|
I have to admit that just about everything I read in this article on thermoluminescence, not to be confused with incandescence or luminescence, was new information to me - or at least I had no remembrance of having known it before. The "memory" characteristic of thermoluminescent materials is especially interesting. Donald Lancaster's treatise appeared in the March 1969 issue of Electronics World, so it is safe to assume that there is some relevance to electronics, right? At least as presented here, electronics plays a role in instrumentation for measuring thermoluminescence, not for using the phenomenon as part of electronics devices or instruments. You will still be glad you read through the article even though you'll learn nothing new about electronics. Thermoluminescence Theory & Applications By Donald E. Lancaster
Take a chunk of limestone and crush it. Now heat it at a constant rate to kitchen-stove temperatures under laboratory conditions. It will probably emit light, but only while the temperature is increasing. Cool it back down again and repeat the process. Nothing happens. This strange behavior is an example of thermoluminescence, a new and valuable tool of use to the solid-state researcher, the nuclear scientist, the medical doctor, the geologist, and the archeologist. Thermoluminescence is the release of light in a crystalline material as it is heated at a constant rate. The light is proportional to the previous nuclear radiation dosage the material has received. Once the light is produced, the previous radiation history of the material is "erased" as the thermal cycling performs a destructive readout of the sample's past history. Had we measured the output light produced by the limestone sample and made a few other measurements and assumptions, we could find out either how old the limestone is or else how long it has been since it had last been heated. Conversely, we could heat-cycle our piece of limestone to erase all the old radiation history. Any measurement made in the future on this sample would tell us how much new radiation the limestone had been exposed to since we last heat-cycled it.
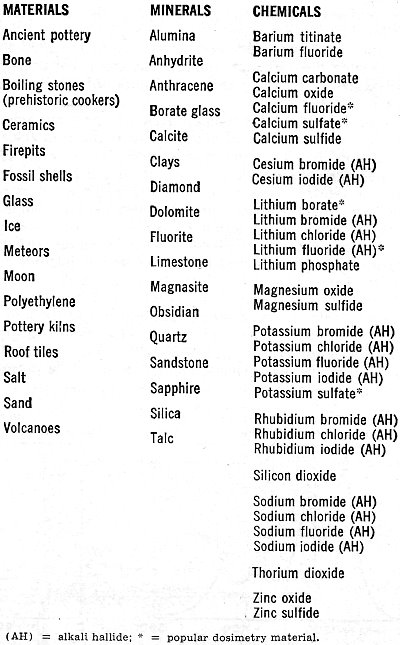
Table 1 - A listing of various thermoluminescent materials. Thermoluminescence is then a two-way street; it can either tell us how long it has been since a substance was last heated, if we make some assumptions about dosage rate; or it can tell us how much radiation has been picked up in a given time. The "how long?" is of value to geologists and archeologists; the "how much?" is important to doctors using radioactive treatment and to nuclear scientists and other personnel exposed to possibly dangerous radiation levels. Before looking further at this new field and its exciting applications, we must note that thermoluminescence is a very specific effect. It should not be confused with incandescence or luminescence, the ordinary light you get when you heat something up red hot or hotter. The temperatures involved in thermoluminescence are far lower. While the maximum temperature involved is around 600°F, most of the light is obtained at much lower temperatures. In fact, ice can be made to thermoluminesce. The Basic Mechanism Crystals can suffer radiation damage just like people can, and the damage is a cumulative effect that can be picked up in a single big blast of radiation, or over a very long time at very low radiation levels. Consider a crystalline substance that is also an insulator or a semiconductor. Table salt will do. Assume that it is initially a perfect crystal, without any impurities or mechanical problems. If we looked down into the crystal, we'd see a crystal lattice, a nice orderly arrangement of sodium and chlorine ions, one after the other, alternating in all three directions. Strong forces, called valence bonds, will try to hold all the ions in perfect alignment. Should we heat the crystal, thermal agitation will excite the individual ions. The higher the temperature, the greater the ion energy level, and the more likely the valence bonds will be broken. If we provide too much heat, the bonds all break and the crystal melts. Things are fine with our crystal until some high-energy particle comes along-the familiar alpha, beta, or gamma particles we'd get in any nuclear reaction, or perhaps a particle from an ultraviolet laser. One of these particles can "blast" one of the ions and literally knock an electron into orbit. In the process, the electron gets its own energy level raised so high that it cannot be recaptured by its own ion, and thus is free to wander throughout the crystal lattice. If more and more particles strike the crystal, more electrons get knocked loose and are free to roam around the crystal; they all have too much energy to get recaptured, and an electron cloud forms. The greater the radiation, or the longer the radiation dosage lasts, the bigger the electron cloud. Electron clouds cannot thermoluminesce by themselves. If crystals were perfect, there would be no thermoluminescence. But crystals have imperfections. They can have impurities locked in their lattice structures, just like the n and p impurity doping in semiconductors. They can have mechanical structure defects. At higher temperatures, they can have "statistical" defects, caused by thermal agitation. Some of these defects can capture a loose electron. These are called traps, and once an electron gets trapped, it is stuck there, at least for the time being. A trap that has caught an electron is called a filled trap. The greater the radiation dosage, the more electrons get knocked loose, and the greater the number of filled traps. Each trap can only supply so much holding energy to an electron. If we heat the material, the electrons can achieve enough additional thermal energy so that the trap releases the electron. Certain types of traps will also cause the electron to release its own excess energy in the form of light when the release temperature is reached. These traps produce thermoluminescence; they are also closely related to the mechanisms that determine the color of the substance. Once the electron has released its excess energy, it is free to once again get captured by an ion with a missing electron, removing the effect of the radiation dosage. To summarize, energy from external radiation increases the energy of some internal electrons and breaks them loose, forming an electron cloud. Some of the electrons get trapped by crystal imperfections. Heating the crystal at a later time releases the extra kinetic energy stored in the trapped electrons and, for certain traps, the excess energy is liberated as light, thereby producing thermoluminescence.
Fig. 1 - (A) Typical glow curve. (B) Typical dosage curve. Some traps can very tenaciously hold onto an electron, while others can only retain one weakly. These are called high-energy and low-energy traps. There are usually many more low-energy traps. A slight temperature increase can empty a low-energy trap, while a large temperature increase is needed to empty a high-energy trap. When long, uniform dosage rates are being used, the equilibrium temperature is defined as that temperature at which thermal agitation is emptying the traps just as fast as incident radiation is filling them. Glow Curves If we take some crystalline substance with imperfections and blast it at a fairly low temperature with nuclear radiation, and then crush the sample and heat it at a constant rate, we would get a light-vs-temperature curve called a glow curve. One such curve appears in Fig. 1A. The glow curve has glow peaks that correspond to different energy-level traps that get progressively released as the increasing sample temperature provides more and more thermal energy. The shape of the glow curve depends upon the material selected, as does the position of the glow peaks and their number. The total area under the glow curve, or the total light produced, is proportional only to the received radiation dosage and nothing else. While the heating rate will affect the height of the glow peaks, it does not affect the total amount of light produced. If we ran the glow curve over and over again for increasing dosage rates, we would generate a dosage curve, such as that shown in Fig. 1B. Dosage is normally expressed in rads. One rad is equal to 100 ergs of absorbed energy per gram of sample. As the figure shows, the total recovered light is proportional to the radiation dosage. With suitable calibration, we can find what the dosage was - simply by measuring the total light produced when the glow curve was generated. An extreme dosage could fill up all the traps and saturate the material. However, this is usually such an extreme amount of radiation that almost all thermo luminescent measurements are made well down on the dosage curve, retaining a linear relation between dosage and light level. The output light is shown in relative units. The actual output depends upon how the material is prepared, the number of traps, the optics and photomultiplier in use, and the electronic amplification. Calibration is necessary when a substance is undergoing measurement. By exposing the material to a known radiation dosage, an output light level will be obtained. This level can be compared to a measured output to determine an unknown dosage by simple proportion.
Fig. 2 - Glow curves produced (A) when material is irradiated at low temperature and thermoluminescent measurement made immediately. (B) When material remains at "room" temperature for long time, and (C) when material is annealed at high temperature. How much light is produced depends upon the material and the dosage. Some materials put out enough thermoluminescence to read a newspaper by for several minutes; others emit light so feebly that elaborate precautions are needed to get meaningful results. Some materials do not thermoluminesce at all. Table 1 lists some of the more interesting materials, minerals, and chemicals that exhibit thermoluminescence. All we require is that a material have an ordered crystalline structure, or at least a semi-ordered, glass-like structure. It can be either an insulator or a semiconductor, but must not be a conductor. It has to have light-producing traps, so the material requires either impurities or imperfections in its structure. As the table shows, there are many materials that meet these requirements. One group of chemical compounds that produces useful thermoluminescence are the alkali halides, of which ordinary table salt is a typical member. These have been widely studied. Several alkali halides are used as dosimetry materials in quantitative applications of thermoluminescence. One popular alkali halide is lithium fluoride. It thermoluminesces brightly, is chemically stable, reasonably non-toxic, and easy to form into bar, rod, disc, or powder. It, along with other dosimetry materials and instruments, is available from companies such as Controls for Radiation, Inc., 130 Alewife Brook Parkway, Cambridge, Mass. 02140 or Harshaw Chemical Company, 1945 East 97th St., Cleveland, Ohio 44106. The cost runs $8-$20 per gram, but since only a fraction of a gram is needed per measurement, and since many materials are reusable, the price per measurement is quite low. Actually, very pure lithium fluoride does not thermoluminesce very well because there are not enough traps to produce a useful light output. To get around this problem, impurities are introduced purposely to increase substantially the number of traps. These impurities are called activators, and are often trace quantities of magnesium, terbium, europium, or other rare-earth elements. By close control of the amount and type of activator, sensitive, stable, and reproducible dosimetry materials are obtained. Further refinements, particularly in controlling which lithium isotopes get into the final material, allow the material to discriminate between different types of atomic radiation. Neutrons are particularly easy to identify with one commercial dosimetry powder. Important Side Effects
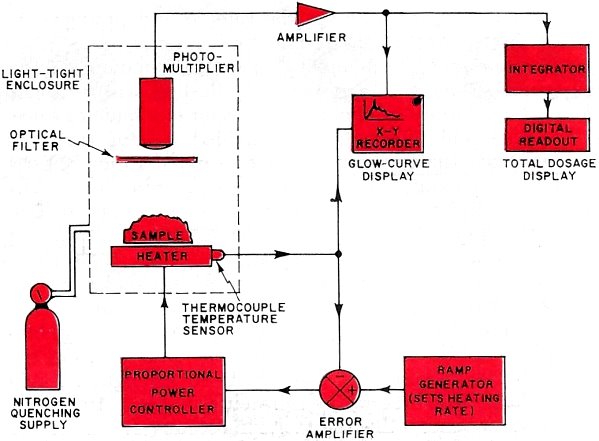
Fig. 3 - Instrumentation used in thermoluminescent measurement. Servo-controlled heater assures constant heating. Before we look at how to make a useful thermoluminescence measurement, we have to consider several important side effects. How long the material has remained at what temperature is very important. If we are researching materials, we would purposely irradiate the substance at a low temperature and then run the entire glow curve, possibly getting a glow curve such as the one shown in Fig. 2A. If we are dealing with an archeological ceramic or a Pre-Cambrian rock, it has remained at "room" temperature for many centuries. This, combined with a low and constant dose rate, wilt cause all the low-energy traps to be emptied eventually, and a glow curve such as the one in Fig. 2B will usually result. Note that all traps lower than "room" temperature have been emptied. There is even a slight chance that traps above this temperature have been slightly emptied. This problem is avoided in geological and archeological dating by using only the highest temperature glow peaks; these are far above the equilibrium temperature and most likely have not been disturbed. To empty a material of all its previous radiation history, we anneal it by heating. For effective annealing, the material is first heated to a very high temperature for a relatively short time, and then to a moderate temperature for a relatively long time. The two-step process favors emptying both low- and high-energy traps, and a no-light curve of Fig. 2C results. We anneal a material whenever we want to erase its entire dosage history up to the present time. A second side effect is called spurious luminescence. Other factors can make a material emit light. These factors include how it was ground, the pressures it has been subjected to, organic combustion, and chemical activity. Spurious luminescence is a particularly acute problem in archeological dating. This is because low dose rates for a relatively short time on a relatively poorly thermoluminescing material result in very low light levels that are easily masked by the spurious effects. Most of the spurious luminescence is caused by oxygen in the air. We can get rid of most of it by making the measurements in a nitrogen atmosphere. This is called nitrogen quenching, and works only if the nitrogen is very pure. Spurious luminescence may be further reduced by a reducing paint near the sample. The reducing paint chemically "grabs" any oxygen remaining on the surface of the material under test. There are other side effects. Pressure - either from grinding or, in eons gone by, in geological activity - can affect the glow curves. The sample size and its preparation are critical for optimum results. The heating rate is also critical, for heating too slowly does not produce enough instantaneous light, and heating too fast skews the glow peaks and makes them hard to interpret. Rates of 1° C/second to 25° C/second are often used in routine dosimetry measurements. Instrumentation Employed
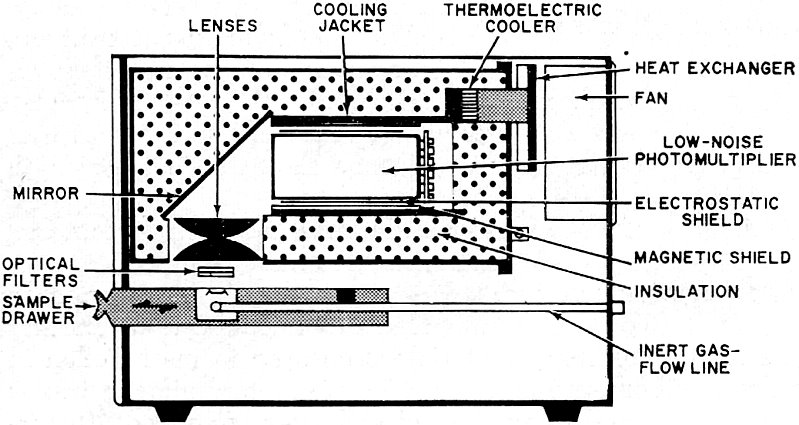
Fig. 4 - Details of sample holder in commercial instrument. To make a thermoluminescence measurement, we have to heat a sample at a constant rate and observe the light produced. A system for doing this is shown in Fig. 3. The sample typically weighs around 30 milligrams and is sometimes processed to form a thin disc-shaped spot, perhaps half an inch across. To get precise temperature control and a constant rate of rise of temperature, servo feedback is used. We start with a ramp generator that controls a proportional power controller, usually using an SCR or a triac. This drives the sample heater. A temperature sensor on the heater produces a feedback voltage that is compared against the ramp generator's output; any differences alter the heating power applied to linearize the results. A photomultiplier observes the sample and produces an output proportional to the thermoluminescence. The enclosure surrounding the sample, heater, and photomultiplier must be light-tight, and is normally flushed with nitrogen from a tank supply to eliminate any spurious luminescence. The photomultiplier output is amplified and, together with a signal from the temperature sensor, is fed to an X-Y recorder that generates the glow curve in graphic form. The photomultiplier output also goes to a charge integrator that calculates the total light produced, digitizes it, and presents the total dosage on a digital readout. A heater and photomultiplier assembly are shown in Fig. 4. It has several refinements over the basic measuring process just described. The light path is bent to put the photo-multiplier outside of any direct infrared radiation from the sample heater. Lenses and a mirror bend the light suitably but are largely opaque to the infrared radiation. An optical filter also enhances the thermoluminescence signal at the expense of spurious and infrared background. The photo-multiplier is a very-low-noise type. It is shielded both magnetically and electrostatically to prevent internal light and noise from being generated. The photomultiplier is cooled with a thermoelectric cooler which keeps the background noise low and uniform, regardless of whether the measurement is at the high end or the low end of the glow curve; the entire assembly is suitably insulated. A complete instrument is shown in the photo. This is the Harshaw Chemical Model 2000 thermoluminescence analyzer. The left unit contains the sample drawer, heater, and photomultiplier, while the right one contains the integrator and dosage readout. Other features include a calibration light source, a sample vibrator and dispenser, and direct-temperature readout. An additional X-Y plotter is needed if a glow curve is to be obtained. If quenching is desired, an external connection must be made to a nitrogen tank. Nuclear & Medical Applications
A complete thermoluminescence analyzer. Unit at left contains sample drawer, heater, and photomultiplier; the unit at the right contains the integrator and the digital readout. One application of thermoluminescence is in basic solid-state research. Crystals with slight impurities are the keystone of today's solid-state materials. Basic thermoluminescence studies can add new knowledge to this all-important field. Thermoluminescence can be a much more sensitive radiation indicator than either a Geiger or a scintillation counter, as it responds to the total dosage through time instead of making an instantaneous or short-term measurement. For nuclear prospecting and for radioactive deposit mapping, thermoluminescence can be a highly sensitive radiation indicator. Rock samples near a suspected radioactive source have dosage measurements made on them; results of the dosage measurements plot extent and value of the deposit. To protect people working around a nuclear reactor or other dangerous radioactive source, badges using lithium fluoride are often worn. Special finger rings are also used where people might expose only their hands to radiation hazards. These badges and rings are annealed before being issued; the resultant thermoluminescence as a result of use indicates the dosage the person wearing the badge has absorbed. Personal dosage histories are kept easily and accurately this way. Compared to the film-badge technique, thermoluminescence is more accurate and less dose-dependent at low dosage rates. A similar measurement was recently applied to roof tiles recovered from Hiroshima, plotting the extent and strength of the atomic-bomb radiation. Much of today's cancer and tumor research is centered around radioactive treatment. Thermoluminescence provides an attractive method of measuring the actual dosage absorbed. To do this, annealed lithium fluoride or another one of the dosimetry materials is encased in inert Teflon in either a pill or a probe shape. The dosimeter built this way is either implanted or swallowed and later recovered after irradiation or other radioactive treatment. The thermoluminescence gives an accurate account of the total dosage. Uses in Geology & Archeology There are many geological uses for thermoluminescence. By comparing the total thermoluminescence to date of two different rocks, the relative age of one with respect to the other can often be determined. By making certain assumptions as to what the dose rate was, an absolute dating scale may also be obtained. To do this, the sources of radioactivity affecting the sample must be known, as must the sample's susceptance to thermoluminescent activity. Given these two factors, the absolute age is readily determined. Subtle changes in equilibrium temperature of a material can give profound clues of past climatic activity. Thermoluminescence tests run in Antarctica have placed a bound upon how long the area was cold. The moon is one big thermoluminescence machine. For fourteen days, the hot surface temperature anneals all the surface materials. For fourteen more days, when the surface is around on the dark side, high-energy particles from the solar wind fill the traps on surface thermoluminescent materials. As the surface comes around to the sunny side again, it is heated at a fairly constant rate and provides thermoluminescence for a few hours. Astrogeologists are able to draw certain conclusions about meteors and surface materials on the basis of this evidence. The newest application of thermoluminescence is in archeology. It can provide absolute calendric dating of ancient pottery. When a pot is fired, it is also convenient., annealed, and its past radiation history is erased. From the firing on, the slight thorium and uranium impurities in the clay emit high-energy particles which fill the traps with electrons. To find the age of the pot, a sample is crushed, separated into optimum size particles, and its thermoluminescence is measured. The amount of new dosage is found which produces the same amount of thermoluminescence by annealing and the reradiating with a known dose. Finally, the particle emanation caused by the uranium and thorium impurities is measured. Knowing the dose rate and total dosage, a simple division gives the age of the ceramic. Today, this technique is just beginning to be put to use. There are important advantages of thermoluminescence over the popular carbon-14 dating technique in that the dating is applied to the artifact itself, the pottery is widely available for testing, and sample contamination and dosage uniformity are not as significant. Other archeological applications include the evaluation of pre-pottery stone boilers, cave temperatures, firepits, and kiln temperatures. The technique is also a powerful tool for identifying fake "ancient" pottery.
Posted December 4, 2017 |
|

 Certain materials, when heated, release light proportional
to previous radiation dosage. This provides a powerful, versatile tool for solid-state
research, nuclear safety, medical dosimetry, geological age determination, and for archeological
dating.
Certain materials, when heated, release light proportional
to previous radiation dosage. This provides a powerful, versatile tool for solid-state
research, nuclear safety, medical dosimetry, geological age determination, and for archeological
dating.