January 1933 QST
 Table
of Contents Table
of Contents
Wax nostalgic about and learn from the history of early electronics. See articles
from
QST, published December 1915 - present (visit ARRL
for info). All copyrights hereby acknowledged.
|
Amateur radio operators, as with hobbyist
participants in many other realms, historically have contributed significantly to
the efforts of their professional counterparts. I have written of it often. This
particular instance is where signal measurements in the Ham bands during a total
eclipse of the sun (August 31,
1932 in this case) were used to assist scientists debating the merits of rival theories
relating to origin of ionization in the
Kennelly-Heaviside Layers of the E and F regions, both of which were proposed in 1902 (yes, the
Heaviside of step function fame). Long distance (DX) communications are dependent
upon such ionization to reflect radio signals that would otherwise pass through
the atmosphere and into space. The test at hand would settle the argument since
the one should fail if ionization was unaffected during totality. Read the article
(or skip to the end) to discover which gentleman's theory won the day.
BTW, the next total solar
eclipse visible from the United States occurs on April 8, 2024. Incredibly
(for me, anyway) the center of the path of totality runs directly through my
property in Erie, Pennsylvania!
Amateur Observations During the Total Eclipse of the Sun
By R.W. Woodward, W1EAO
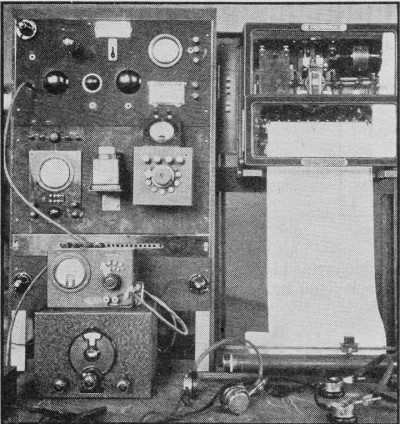
Equipment used at the Case School of Applied Science, Cleveland,
for graphical recording od the signals of W1EKL.
The output of the receiver was fed though a vacuum tube voltmeter
to the standard Leeds and Northrup recorder with paper speed stepped up to record
rapid variations. This work was under the direction of J. R. Martin, Assistant Professor
of Electrical Communications. assisted by W. E. Slabaugh, W8CIM. and L. W. Fraser.
W8DGP. Thanks are due to MT. Fraser for this information, including the photographs
and copy of the recording shown in Fig. 6.
The total eclipse of the sun on August 31, 1932, afforded a wonderful opportunity
for the radio amateur to contribute to our scientific knowledge of short-wave transmission
phenomena, and more particularly to obtain information which would lend support
to one or the other of two rival theories concerning the origin of the Kennelly-Heavyside
Layers.
One theory supposes that the ionization of the reflecting layers (both the so-called
E and F layers) in the upper atmosphere is caused, for the most part, by ultra-violet
light from the sun. The other theory holds that the ionization of the lower, or
E layer, is produced by neutral particles or corpuscles streaming from the sun at
a rate of a thousand miles per second. If the first theory is tenable, any effect
on radio transmission during the eclipse should correspond approximately with the
time of the visible eclipse. On the other hand, if the corpuscular theory is acceptable,
the effect on radio propagation should precede the visible eclipse by some two hours
due to the slower velocities of the corpuscles coming from the sun as compared to
the speed of light. Whereas the visible total eclipse cut a swath only about 100
miles wide across a part of New England and eastern Canada, the "corpuscular eclipse"
would be maximum on a path starting from Spitzbergen, through Greenland, the mid-Atlantic
Ocean, and ending at lower Spain. It would cover a path about 1600 miles wide, not
touching the United States.
Equipment used at the Case School of Applied Science, Cleveland, for graphical
recording of the signals of W1EKL. The output of the receiver was fed through a
vacuum-tube voltmeter to the standard Leeds and Northrup recorder with paper speed
stepped up to record rapid variations. This work was under the direction of J.R.
Martin, Assistant Professor of Electrical Communications, assisted by W.E. Slabaugh,
W8CIM, and L.W. Fraser. W8DGP. Thanks are due to Mr. Fraser for this information,
including the photographs and copy of the recording shown in Fig. 6.
As requested in QST, by Official Broadcasts and by letter to Official Observers,
a great many A.R.R.L. members all over the country and in some European countries
sent in reports to head-quarters on their observations during the eclipse. Particular
attention was directed to the transmissions of W1EKL, a portable station located
at Douglas Hill, Maine, in the path of totality by a party from the Warner &
Swasey Observatory of Cleveland, Ohio. Prior announcements indicated that this station
would transmit c.w. on 3550 or 7100 kc. between the hours of 1400 G.C.T. (9 a.m.
E.S.T.) and 2300 G.C.T. (6 p.m. E.S.T.), but implied that the 80-meter (3550-kc.)
wave would be used. Observations on intensity of received signals, preferably by
means of a suitable output meter, throughout the entire period were desired. On
the day before the eclipse it was determined that the 80-meter signal was not strong
enough for automatic recording in Cleveland, so that it was necessary to use a frequency
in the 40-meter band. Actually during the eclipse transmission a frequency of 7150
kc. was used. Because of this change in the frequency practically no reports on
reception of W1EKL were received at headquarters as many of the reports indicated
that watch was kept for W1EKL on 80 meters. Also because of skip distance the station
on 40 meters could not be heard in the eastern part of the U.S.A. It is understood,
however, that very satisfactory automatic records were obtained in Cleveland and
also that many reports of reception were received direct by W1EKL.
Possibly also many of the eastern observers did as the writer, who, after spending
several days arranging equipment to take intensity measurements during the eclipse,
and in spite of rain at the time, hopped in the car a few hours before the eclipse
and drove to Maine for a ring-side seat. At any rate, many A.R.R.L. emblems were
seen on the road.
W1BZI operated by F.S. Huddy at Chepachet, R.I., where the eclipse was 98% total,
made special eclipse transmissions on 3896 kc. between 1900 G.C.T. and 2100 G.C.T.
(2 and 4 p.m. E.S.T.) and was reported by many observers, several of whom gave very
complete readings from vacuum-tube voltmeters in the output of receivers. Some submitted
reports from privately arranged schedules, others of reception of commercial stations,
and still others logs of scattered reception of many stations on the air at the
time. The data included results on the 5-, 20-, 40-, 50-, and 160-meter amateur
bands, broadcast band, and long wave commercial. Several also submitted interesting
data on accompanying phenomena such as static conditions, atmospheric pressure,
temperature, clouds, wind, and light intensity.
In spite of the request to take observations throughout the day, the majority
failed to do so, reporting only for a short period before totality and a still shorter
period after totality. This was important not only from the standpoint of testing
the "corpuscular" theory, but also, particularly on 20 meters where longer distances
were involved, the time of the maximum of the eclipse was quite different in the
several sections of the country. Thus the maximum of 38% totality occurred in Seattle,
Wash., at 1927 G.C.T. (2:27 p.m. E.S.T., 11:27 a.m. P.S.T.), at Tallahassee, Fla.,
the maximum of 68% was at 2047 G.C.T. (3:47 p.m. E.S.T.), while the time of totality
in New England was approximately 2030 G.C.T. (3:30 p.m. E.S.T.).
The following contributed reports on their results to headquarters:
W1 - AFC, AGA, APK, ASP, ATW, AZQ, BBM, CTG, DGC, DIJ, MX, ST, VF; W2 - BJZ,
EB; W3 - AAJ, AXJ, CL, DZ, QL; W4 - ADA, AJS, AYF, PM; W5 - AAQ, ARJ; W6 - DLV,
RJ; W8 - AJ, AJK, ATN, CBF, DED; W9 - ABS, AKJ, AN, AOG, BN, EGE, EQW, FMX, RS,
Chas. E. Dewey, Jr.; VE4EL; F8RJ; G2JA at sea on S.S. Rangitiki; ON4AU.
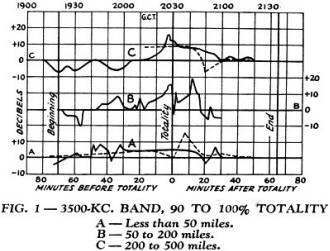
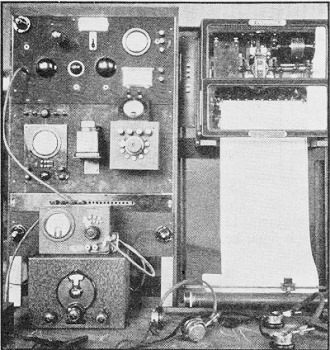
Fig. 1 - 3500-kc. Band, 90 to 100% Totality A - Less
than 50 miles. B - 50 to 200 miles. C - 200 to 500 miles.
The reports received showed that the following stations were heard during the
eclipse period, many transmitting special test signals. A great many reports did
not list individual stations but classified their results by districts so that no
doubt hundreds of additional stations also contributed to the results.
W1 - ABM, ABY, ADN, AHK, AKI, APJ, APK, AT, AVK, AYR, BBT, BCD, BDW, BIC, BGY,
BTZ, BWP, BXC, BZB, BZD, BZI, CAC, CBJ, CKT, CKU, CLH, CMX, CNC, CPC, CPT, CVJ,
CVR, CYN, DIJ, DZF, EKL, FH, GB, HE, HI, JJ, MX, SI, ST, SZ, ZC; W2 - ABT, AHE,
AIS, AWF, BHZ, BJV, BOT, BPV, BRO, BTZ, CJM, COJ, COK, DNG, DTO, DZ, GO, GT, NV,
ZC, ZT; W3 - AGI, ANA, AO, AQI, AQR, AUA, AXR, AZC, BIN, BLE, BMA, BNB, BOL, BXN,
BYN, CDG, CEU, CGU, CLG, CNU, COZ, CUP, DIR, DR, LA, OA; W4 - ADA, AGD, AJX, APJ,
ATS, AUA, AWP, BIO, BL, BOJ, BQO, DV, GI, OI, OT, QQ, UT; W5 - AAK, ABW, AOT, ATS,
BBR, BED, CAI, COC, JV, LP; W6 - CTM, CXW, DOB, DZZ, USA; W8 - AFQ, AGU, AHF, AKU,
APQ, AZQ, BAS, BM, BOG, BTB, CBF, CBM, CDY, CI, CIF, CIP, CSH, CTE, CTF, CXH, DHC,
DIL, DJV, DMW, DWV, DYE, ECD, EEN, ELF, EYU, FBT, FGE, FNN, FQE, FXM, GCF, GFI,
GFT, GTE, HEL, HII, SE; W9 - AN, ARK, AUH, BDR, BHH, BOF, CJJ, CME, CMZ, CNG, DGN,
DKL, DYG, ENR, FFA, FKK, FMK, FPA, FWB, FZL, GHX, GJC, HOS, HPQ, HUZ, HWE, IMB,
IPP, IZP, JBM, JBQ, JHL, JJX; AB1; K5AA; VE - 1EA, 2AW, 2BF, 2GH, 3AQ, 3TT, 9AA;
CM - 2FM, 2WD, 8VE; EAR - 96, 155, 185, 224, 228; F8 - BS, OL, RJ; G - 2BM, 2OP,
2ZP, 5NF, 5OJ, 6CL; HAF3FV; HK1Z; LU3DE; OK2CM; ON4AU; PY2BN; VP2 - DB, DD; SU1EC;
and the following commercials on which listening tests were made: DGG, FYL, GID,
G5SW, HJO, KDKA, KFYR, KKZ, TIR, VE9GW, WAZ, WEAF, WQP, W2XAD, XDA.
From the mass of heterogeneous data submitted, involving so many variables, the
problem of digesting and condensing the results so as to put them in a form for
simple presentation can well be appreciated. Some of the variables encountered are
time, location and extent of eclipse at transmitter, location and extent of eclipse
at receiver, frequency of signal, transmission distance, power of transmitter, intensity
of received signal, method of measuring intensity, and the ever present personal
equation including such items as possible errors in time recording, operation of
receiver at optimum sensitivity, and the estimation of intensity of signal where
the R system was employed. Not the least confusing factor was the failure of many
to report the system of time used.
The scheme finally adopted was to show typical graphs of change in intensity
of the received signal plotted against time for several conditions in each of the
amateur bands. The sub-conditions are the extent of the eclipse over the transmission
path, including areas having 90-100% totality, 75-90%, 50-75%, and less than 50%;
and the transmission distance, including local, an intermediate distance where skip
effect would be expected under night conditions, and longer distances up to the
maximum range of the band.
The intensity changes are reported as decibels above or below a normal level.
Where the R system was used a change in one number, such as from R8 to R7, or R5
to R6, was considered as a change in received energy of four decibels. The time
ordinate shown is minutes before and after totality (or maximum extent of eclipse)
considering the mean time of the maximum over the transmission path. For convenience
of those desiring to compare the time with their own observations, the Greenwich
Civil Time is also shown on the basis of totality occurring at 2030 G.C.T. (3:30
p.m., E.S.T.). At Douglas Hill, Maine, the computed times of the various phases
of the eclipse were: first contact, 1920; second contact, 2028:47; third contact,
2030:24; and fourth contact, 2134 G.C.T.
Fig. 2 - 3500-kc. Band, 75 to 90% Totality A - Less than
50 miles. B - 50 to 200 miles. C - 200 to 500 miles.
All the data were examined and found to agree very well with the typical curves
shown with only scattered conflictions. A few unusual transmissions were reported
but they must be considered as freaks which so often occur in short-wave work, their
occurrence being increased by the greater number of stations on the air during the
daytime and the extra vigilance of receiving operators.
General Conditions
Cosmic data supplied by "Ursigram " messages showed that the 24 hours from 1400
G.C.T., August 31st, to 1400 G.C.T., September 1st, was classed as a quiet day as
far as terrestrial magnetism data was concerned. The preceding two days were days
of moderate magnetic disturbances, and August 27th and 28th were classed as days
of great disturbances. One sun spot, with a Wolf number of about 8 was visible on
August 31st and passed from the face of the sun on September 2nd. Prior to this,
two sun spot groups had crossed the face of the sun beginning on August 23rd and
reaching a maximum Wolf number of about 24 on August 26th. The aurora displays for
the days in proximity to August 31st were faint to moderate as observed at College,
Alaska. Parenthetically it might be mentioned that the writer has observed on days
when brilliant aurora were visible in New England, accompanied by violent magnetic
storms, that the skip distance was greatly reduced; 15-meter signals were heard
at a distance of 100 miles that under normal conditions were never heard.
The weather maps for the period of the eclipse showed a tropical storm progressing
inland in the Gulf States. Rain occurred in the northeastern states, the Gulf States,
and the Middle West. No pronounced isotherms were indicated for the eastern part
of the country but temperatures were mostly above normal. Pressure was low in the
Gulf States and high in the Middle West. There was no sharp pressure gradient in
any part of the country except in the vicinity of the tropical disturbance. Scattered
thunderstorms occurred over most of the eastern half of the United States on the
afternoon of August 31st. The western half was mostly clear with temperatures below
normal.
From these data it may be reasonably concluded that on August 31st radio transmission
should have been approximately normal and that marked variations from normal could
be associated with the solar eclipse. From the many local thunderstorms irregularities
in QRN could be expected. Those observers who mentioned the fact confirmed that
transmission was normal on August 30th, August 31st, and September 1st.
160-Meter Band
As is usual during the daytime, there was little activity on this band and too
few reports were received to allow drawing any conclusions regarding any change
in conditions during the eclipse.
80-Meter Band
A great many reports were received on observations in the 80-meter band and since
the transmission distance was generally such as to include an area of nearly uniform
solar coverage, the results are easier to interpret. Although both phone and c.w.
stations were on the air with test signals, the best data received were on the c.w.
signals since with the equipment usually accessible to the amateur it is more difficult
to measure variations in intensity of modulated carriers. The curves shown are for
c.w. signals but are equally applicable to phone transmissions.
Fig. 1 gives results in the area of 90 to 100% totality, all reports on
reception of W1BZI. The A curves are typical of results at less than 50 miles, or
little more than local distance. The solid line is reception reported by W1AGA at
a distance of 40 miles in the zone of 99% totality, while the dotted line indicates
the readings of W1AFC at 38 miles, also in the 99% zone but in a different direction
from the transmitter. These show irregular "sunset" effects or fading in the early
and late stages but with a general rise in level at totality. The dotted line indicates
a decided peak lagging behind totality.
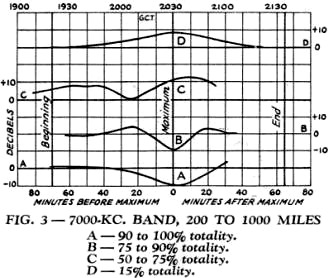
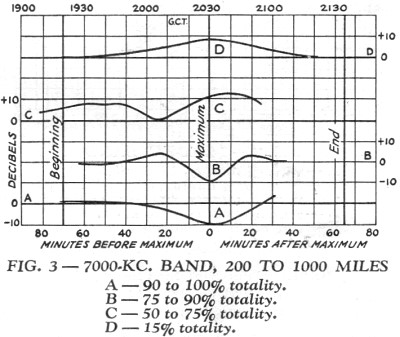
Fig. 3 - 7000 kc. Band, 200 to 1000 Miles A - 90 to 100%
totality. B - 75 to 90% totality. C - 50 to 75% totality. D - 15% totality.
The B curve records the results obtained by W1ASP at a distance of 75 miles in
a zone of 96% totality, and is typical of results from 50 to 200 miles. This distance,
which at night would be expected to show skip on 80 meters, also shows irregular
"sunset" fading but a greater rise in signal strength than the A curves. Lagging
about a minute behind totality was a pronounced clip or tendency towards skip, for
a short interval. This was followed by a large increase after which the signal rapidly
returned to normal volume.
The C curves show results typifying distances greater than 200 miles which is
about the maximum distance possible within the limit of 90% totality which was set
for Fig. 1. The full line is the data reported by W3DZ and W3CL, the dotted
line those of W3QL, all in zone of 93% totality and about 225 miles from the transmitter.
Tendency towards skip is shown in the early phases and after totality. Signal strength
was considerably raised over normal, in this case peaking about three minutes before
totality without a corresponding peak following. The observations for the dotted
line were not taken at as frequent intervals as for the other curves and hence show
less irregularity.
Fig. 2 indicates results in the area of 75 to 90% totality for the 80-meter
band. Curve A was submitted by W9BN on reception of W9AN at a distance of 44 miles
with the eclipse about 76% total. Irregular fading is shown with peaks of increased
signal before and after the maximum of eclipse and a pronounced dip between the
two peaks, all lagging behind the visible eclipse.
Curve B is a composite of several reports at distances of 50 to 200 miles. It
appears to be somewhat parallel to A. Curve C was submitted by W3AAJ on reception
of W1APJ at a distance of 390 miles and the eclipse about 90% mean totality over
the path. Signal strength is well above normal and peaks about seven minutes after
the maximum coverage of the sun. In addition to this curve C, in the 75 to 90% zone
R6 signals were reported at 600 miles, R3 at 800 miles, and DX of 1000 miles at
the greatest extent of the eclipse.
In the area of 50 to 75% totality, insufficient data were obtained to admit of
plotting, but the individual reports showed results similar to the 75-90% zone but
to a lesser degree. On the Pacific coast where the eclipse was about 15% total conditions
on the 80 meter band were reported as normal.
40-Meter Band
On the 40-meter band skip distance was such that very few stations at distances
less than 200 miles came through at any time of the day. W1EKL could not be heard
at W1EAO a distance of 200 miles at the beginning of their schedule at 1400 G.C.T.
(9 a.m. E.S.T.) with the aid of a frequency meter set on 7150 kc. After listening
3 hours, W1ATW (220 miles) heard W1EKL for five minutes at 1700 G.C.T., when he
was lost and heard no more. In areas of greater than 75% totality what few stations
that were heard at distances up to about 200 miles fell out completely near the
maximum of the eclipse.
In Fig. 3 is shown results obtained in the range of 200 to 1000 miles for
various degrees of eclipse. These curves are composite averaged results from a great
many observers and show general tendencies omitting specific fading irregularities.
Curve A shows that near the path of totality signal strength was reduced, the maximum
reduction peaking approximately with totality. As indicated in curve B for regions
of 75 to 90% totality, signals at first increased and then decreased rapidly at
the maximum eclipse coverage. Reverse effects were observed as the eclipse receded.
In regions of 50 to 75% eclipse, curve C, there was at first a slight increase
in signal strength as the eclipse came on. This was followed by a dip to somewhat
below normal and then a maximum increase was observed lagging somewhat behind the
maximum of the visible eclipse. On the Pacific coast with 15% totality, curve D,
signals gradually increased with the partial eclipse and then slowly decreased again
to normal.
Distance reception of greater than 1000 miles was also reported in the region
of about 50% totality at various times throughout the progress of the eclipse.

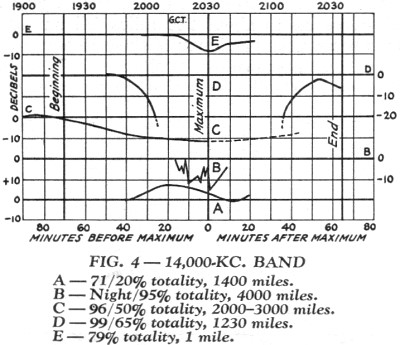
Fig. 4 - 14,000 kc. Band A - 71/20% totality, 1400 miles. B - Night/95%
totality, 4000 miles. C - 96/50% totality, 2000-3000 miles. D - 99/65% totality,
1230 miles. E - 79% totality, 1 mile.
20-Meter Band
The distance of transmission on the 20-meter band is such that widely different
extent of eclipse was present at the transmitter and receiver. In addition, contacts
with European stations were over a sunset area as well as the path of the eclipse.
No attempt has been made to differentiate between the results secured depending
upon whether the transmitter or receiver was at the location of maximum eclipse
effect. Undoubtedly a difference does exist, but there was insufficient data to
make comparisons.
Many reported on reception of high-powered commercial stations with varying results.
W1AFC at 99% totality reported no change in DGG on 22 meters from 1830 to 2125 G.C.T.
(1:30-4:25 p.m. E.S.T.). W1VF at 100% totality reported a noticeable increase in
signals from GID on 24 meters during totality. In the region of 70% totality W9ABS
kept watch on WAZ, XDA, WQP, KKZ and HJO. From 1400 to 1800 G.C.T. the eastern stations
were R5-R7 with marked variations, west coast stations R6 and steady. At 1800 the
east coast stations rose to R8 very steady, but at 1900 dropped out altogether.
The west coast stations increased to a very loud signal. From other sources we learn
that the Canadian Marconi Company found no definite change in 22- to 37-meter transatlantic
reception.
Fig. 4, curve A, shows the variation in reception of XDA (about 20% totality)
on 20.7 meters by Charles E. Dewey, Jr., in Jefferson City, Mo. (71% totality),
at a distance of about 1400 miles. Between these two points there was a time difference
of about 20 minutes in the phases of the eclipse. It would have been interesting
if these observations had been continued for at least an additional hour, as in
all probability another peak intensity would have been found.
It should be pointed out that the commercial channels are operated at a high
power level and at a frequency that will give reliable communication under the prevailing
conditions. On the other hand, amateur contacts on this band (and quite often in
other bands) are with comparatively low power, and more often than not are in the
"fringe" zone of possible contact. It is to be expected then that small differences
in the transmission path would produce a much greater change on amateur transmissions
than upon commercial channels.
European observers of American amateur signals, as well as observations from
midatlantic ocean reported rapid irregular fading together with mushiness of note
caused by high-speed fading during the period at and near totality. Curve B of Fig. 4
shows reception of W2CJM by ON4AU, a distance of about 4000 miles from darkness
to a region of 95% totality and crossing the path of totality. A general reduction
in signal strength peaking with the eclipse is noted.
Curve C indicates composite results of observations taken by G2JA at sea, 1560
miles east southeast of New York and in a region of about 96% totality on the opposite
side of the path of totality from the United States. At this point sunset occurred
at about 2120 G.C.T. Stations received were at distances of 2000 to 3000 miles down
to about 50% totality. This curve shows a regular decrease in signal strength peaking
with the visual eclipse. Results toward the end of the period were partially obscured
by twilight effects, and this part of the curve is given as a dotted line.
In the United States, W1AZQ, in the path of totality, reported European signals
fading out and 6th district coming in at 2000 G.C.T. During totality at 2030 G.C.T.,
only the 5th district could be heard and with diminished strength. From 2105 to
2145 G.C.T. only 4th, 5th districts and Cuba were audible. At 2200 G.C.T. reception
was again near normal with the return of European signals until they disappeared
for the night at 2215 G.C.T.
Curve D shows reception of W1HE (99% totality) by W9AOG (65% totality) at a distance
of 1230 miles. Signals entirely disappeared for about one hour, the center of this
effect lagging about five minutes behind the visible eclipse.
The results, curve E, obtained by W9RS and W9EGE are quite interesting and show
that even in the region of 79% totality the reception of a one-watt oscillator over
a distance of one mile was considerably reduced.
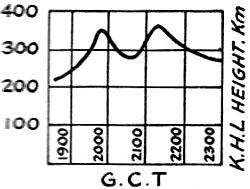
Fig. 5 - Disturbance in F region of Kennelly-Heavyside Layer
during eclipse, 3942 and 4540kc.
Longer Waves
On the broadcast band reports indicated that at distances less than 100 miles
night conditions of mushiness and fading were found during the maximum of the eclipse.
At distances of 200 miles near the path of totality, no changes were observed. Reception
of broadcast stations from four to five hundred miles distant faded completely or
nearly out in various parts of the country, the maximum effect peaking with the
time of totality.
W1AFC found no change in the intensity of FYL on 19,000 meters other than the
normal daily change.
QRN
A great many amateurs reported changes in QRN and were led to the belief that
the eclipse had left a high static level. A few reported no QRN for the entire period.
As mentioned earlier, during the period of the eclipse, there were a great many
areas of scattered thunderstorms throughout the country, most of which occurred
on the afternoon of eclipse day. Analysis of the QRN reports show that without exception
those who reported bad QRN were near a local thunderstorm area, and those who reported
no QRN were at a considerable distance from one. Of course the greater transmission
range during the eclipse also carried the static disturbances over greater distances.
So it appears that the eclipse can not be blamed for QRN conditions on August 31st.
Other Results
Since the eclipse, the results of some other observation parties have become
available and should be mentioned briefly in passing.
The Bureau of Standards reported that measurements made near Washington, D.C.,
showed that the critical frequency for the E region of the Kennelly-Heavyside Layer
decreased about 1000 kc. during the eclipse, lagging behind phases of the eclipse
by approximately five minutes.
Observations made in Canada under the direction of Drs. Henderson and Rose showed
distinct losses in ionization of both reflecting layers E and F regions during the
period of the ideal eclipse and no indications of a corpuscular eclipse.
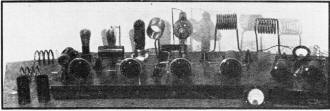
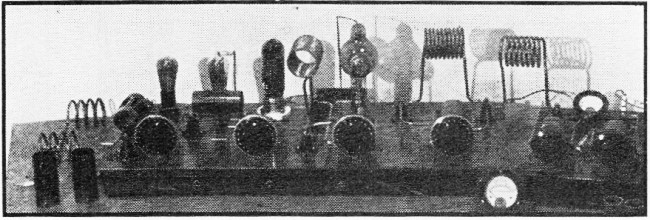
The transmitter used at W1EKL, located at Douglas Hill, ME, with
Sid McCuskey, W8DRP, in charge. The output stage used an 860 with 300 watts input.
Although 3500 kc. operation was first contemplated, a frequency of 7150 kc. gave
better signal strength at Cleveland both day and night.
Messrs. Kenrick, Mimno, Pickard, and Wang gave a preliminary report to the Boston
Section of the I.R.E. on results of automatic photographic records of echo lag behind
ground signals. On 1640 kc. no echoes were observed until ten minutes after totality
(2040 G.C.T.), when the E layer appeared at about 110 km. height. This persisted
until 2110, when it disappeared and the F layer came in at 250 km. and remained
until 2130. No reflections were then observed until 2145 when the E layer returned
until 2200, when it vanished and was replaced by the F layer which remained until
sunset. On 3942 and 4542 kc. no E layer reflections were observed, but there was
an F layer disturbance of double-humped character coinciding with the visible eclipse.
Because of its close resemblance to some of the amateur results of reception, the
curve showing this disturbance is reproduced in Fig. 5.
And now after complete absence of any indication of a corpuscular eclipse, there
appears an article in the public press stating that Dr. E.F W. Alexanderson of the
General Electric, by using a frequency of 8655 kc. between Schenectady, N.Y., and
Conway, N.H., had observed almost complete disappearance of signals two hours previous
to the optical eclipse, and attributes it to a corpuscular eclipse. Although at
this writing complete information on his tests are not available, and full comment
must be withheld, it is difficult to accept his conclusions when it is remembered
that his tests were conducted in a region supposedly outside the zone of a corpuscular
eclipse.
Conclusions
At the outset it was stated that one of the questions which it was hoped to settle
by means of radio observations during the eclipse was whether the ionization of
the upper atmosphere was caused by ultra-violet radiation from the sun or by neutral
particles shot off at a much slower velocity.
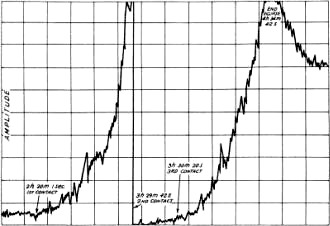
Fig. 6 - The graphical recording of W1EKL's 7150 kc. signals made at Case
School shows a tremendous rise in signal strength between first contact and totality,
the recorder pen going clear off the sheet at totality.
A few seconds later the signal dropped down to the background level and was inaudible
for some 15 minutes. Then it gradually built up and reached a second peak just before
the moon's shadow passed away, the pen again going off the sheet, with the second
peak lasting somewhat longer than the first. The signals then gradually dropped
to the normal level. The eclipse was over.
Amateur transmission was most certainly effected during the eclipse, the maximum
effect in general coinciding with totality of visible eclipse or lagging a few minutes
behind it. In all cases conditions approached those of night, the nearness of approach
depending upon the extent of the eclipse in the region. The return to normal conditions
seemed to be somewhat slower than the onset of the disturbance. On 40 and 80 meters,
double humped intensity curves were observed similar in shape to the variation in
the F layer height found by the Harvard group of observers.
This would seem to prove definitely that ultra-violet light, or some radiation
travelling with the speed of light, is mainly responsible for the ionization of
the upper atmosphere. The findings of scientific observers show that there were
changes in the E and F regions of the Kennelly-Heavyside Layer coincident with the
optical eclipse.
As regards a corpuscular eclipse, and the acceptance of the opposing theory,
very few observations were taken by amateurs which could be used as a basis for
a definite conclusion. What observations were made over a sufficient length of time
and over the probable path of the corpuscular eclipse failed to show any effect
of such an eclipse, if there was one, on transmissions in the amateur bands or on
commercial frequencies close to amateur assignments.
On the other hand, if Dr. Alexanderson's results are accepted then it would appear
that the effect of the corpuscular eclipse was quite small as compared to the optical
eclipse and that the stream of corpuscles or neutral electrons from the sun exert
only a small influence on the ionization of the upper atmosphere. So, for the time
being, at least, we still have the two theories with us.
Many amateurs expressed a regret that it would be a long time before they could
experience the enjoyment of noting the effects of solar eclipses on radio transmission.
The results reported here show quite well that it is not necessary to be in the
path of totality to observe a "radio eclipse." Wherever the eclipse may be, the
ever resourceful amateur can select frequencies and stations upon which he can make
satisfactory and convincing observations. Let's continue to make radio studies of
coming eclipses.
Posted April 21, 2021
(updated from original post on 4/25/2013)
|