|
April 1939 QST
 Table of Contents Table of Contents
Wax nostalgic about and learn from the history of early electronics. See articles
from
QST, published December 1915 - present (visit ARRL
for info). All copyrights hereby acknowledged.
|
Antenna radiation (beam) patterns published
by manufacturers are obtained under ideal - or close to ideal - conditions with
a carefully prepared and calibrated open air test site (OATS) or an enclosed anechoic
chamber. Multipath, imperfect earth ground, obstacles both manmade and natural,
misshapen elements, poor VSWR, antenna orientation (in both azimuth and elevation)
are among the many factors which produce real-world operational results that do
not jive with a manufacturer's datasheet. Without employing some far field 3-dimensional
field strength scheme (see
Drone-Based Field Measurement System™), there is no way to obtain
a complete picture of how your antenna performs in all directions. This article
presents a practical procedure for making measurements that will at least collect
useful data for specific orientations.
Checking Beam Antennas with the S-Meter
Converting Meter Beadings to Decibels for Signal-Strength Comparisons
By S. Gordon Taylor,* W2JCR
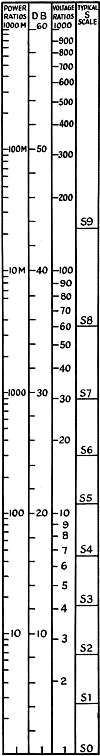
Fig. 2 - Voltage, power and db scales for quick conversion.
The S scale of the receiver in use may be plotted as shown in the right-hand column
so that reports can be given readily in terms of db gain or loss.
The "S" meters now so commonly employed in communications-type receivers are valuable
primarily as an aid in giving uniform signal strength reports, and in the constant
check on the operating condition of the receiver. But with the growing use of rotary
beams for transmitting and receiving such meter equipment is finding a new and important
application in checking the radiation characteristics, and even in plotting radiation
patterns.
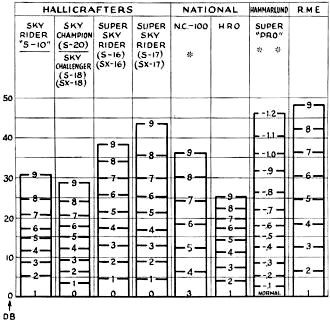
Fig. 1 - S-meter calibrations of various receivers in terms
of decibels. The S scales are arbitrarily chosen by the manufacturers, hence the
wide variation in "db per S point." All values are relative to the lowest S-scale
reading on the receiver, and are independent of the receiver sensitivity. That is,
the fact that, in this chart, one receiver may show a reading of S7 while another
shows S4 for the same db value above does not mean that the signal input would be
the same in both cases.
Many hams recognize the possibilities in this latter application but fail to
take advantage of it because they (1) are unfamiliar with the procedure, (2) are
reluctant to undertake the calculations ordinarily involved, or (3) lack data from
receiver manufacturers which permits variations in S readings to be interpreted
in terms of decibels, power ratios or voltage ratios.
It is the purpose of this article to provide data on a number of standard receivers,
describe simple methods of checking characteristics and plotting patterns of rotary
beams, and provide a chart which reduces calculations to a matter of simple arithmetic
- with not an awful lot of that.
If you have a rotary beam and ask different stations for checks, the results
will normally be of only the most general value because for the most part these
reports will be given in terms of the number of S points difference between your
minimum and maximum signal. A three-S difference on one standard receiver may, in
terms of power ratios, equal a difference of five S's on another receiver, four
S's on a third, and so on. For this reason the S reports from different receivers
are not directly comparable, and it is impossible to arrive at any sort of average
suitable for use in plotting antenna characteristics.
Nor can this problem be solved by arbitrarily assuming some standard db value
per S point, a practice which is quite common. Measurements show that the "db per
S" may average anywhere from 3 to 6 on different standard receivers. This is another
way of saying that with one receiver model S9 may be around 50 db "up" from S1 while
in another model it may be only 25 db up. What is more, the db difference between
S3 and S4, for instance, may be quite different from that between S8 and S9 on the
same receiver and S meter.
What is needed is knowledge of the actual db calibration of the S meters for
the different receiver models, and this data will be found in Fig. 1 for nine
standard receivers. The data on which this chart is based was obtained from the
individual manufacturers, for this purpose (or from their literature in some cases),
and most of it appears in print here for the first time.
The utility of this chart is obvious. It serves to provide a useful calibration
for owners of any of these receivers. Of equal importance, it enables the ham to
interpret, in terms of db, the comparative reports received from others who are
using any of these receivers.
With rotary beams sprouting like mushrooms, the receiver S-meter takes on a new
importance in furnishing a means for giving information on radiation patterns -
provided its readings can be reduced to some standard. The important thing, of course,
is the relative signal strength, easily expressible in terms of decibels. Since
no two receiver S-point calibrations are alike, the information in this article
is particularly timely and useful, and gives the beam owner a means of correlating
signal reports.
Perhaps your receiver has a meter which you installed yourself and on which you
scaled off your version of the S scale. In that case you can obtain the decibel
calibration by comparing your readings on given signals with those of a friend who
owns one of the receivers of Fig. 1. This comparison must of course be made
with the two receivers in the same location and switching the same antenna. It will
be most simple if you calibrate your meter to correspond with the S scale of the
other; then its decibel calibration as given in Fig. 1 will apply to yours
also.
It is perhaps well to point out that the varying heights of the columns in Fig. 1
have nothing to do with the relative sensitivity of the different receivers. In
each case the column height simply represents the relative values which each receiver
manufacturer chooses to employ in designing and calibrating his S meter circuit,
and it is obvious that the different scales are not in agreement. The fact that
some calibrations start at S° and others at S1 is of no importance; this again
simply represents the manufacturer's choice of zero db level but does not in any
way alter the utility of the db data of this chart.
When the owner of a rotary beam receives reports on his front-to-back ratio in
terms of decibels these reports from different stations can be directly compared
with a far greater degree of accuracy than would be the case were the reports simply
given in S points. For example, suppose two receiving stations gave him reports.
One, equipped with a "Sky Challenger" receiver reports readings of S9 for the front
and S3 for the back. The other, using an "NC-100" reports S9 for the front and S6
for the back. On the basis of straight reports (without the data of Fig. 1)
it would appear that the signal variation as observed at the first station is twice
as great as at the second. Convert both to decibels, however, and the reports are
nearly the same - 19 1/2 db and 18 db respectively.
A Translation Scale
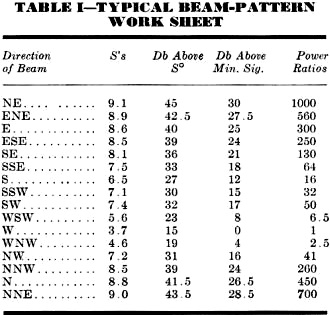
Table I - Typical Beam-Pattern Work Sheet
Fig. 2 provides another tool of great value in checking beams and plotting
radiation patterns. Here the decibel scale again appears, and related directly to
it are power- and voltage-ratio scales. In the last column is the S scale of the
Skyrider SX-17, which happens to be the receiver used at W2JCR. Those having other
receivers should substitute the appropriate S scale.
To illustrate the use of the chart, assume that a rotary beam is being checked.
"On the nose" a reading of S8 is obtained and off the back end the reading is S5.
The db equivalents taken from column 2 are 36 and 21 and the difference is 15 db.
Now referring to column 1 it is seen that 15 db represents power ratio of slightly
over 30, and this is the front-to-back ratio of this particular beam. Thus a specific
and decidedly useful report can be given to the station being checked.
The power ratio could be arrived at immediately without the intermediate conversion
of the S readings to db, but if this is done we get a ratio of something like 3600
to 120, which is rather unwieldy. To reduce it to the simpler terms involves some
mental gymnastics which are much more arduous than the S-db-power conversion scheme.
Although beams are evaluated by hams almost entirely in terms of either db or power
ratios, there are occasions when the voltage ratios are desired and for that reason
they are included in the chart.
Connecting his rotary beam to his receiver, the owner can check its characteristics
by tuning in some other station and noting the meter readings as the beam is rotated.
The conversion to terms of power ratio is then made as described above.
Plotting Patterns
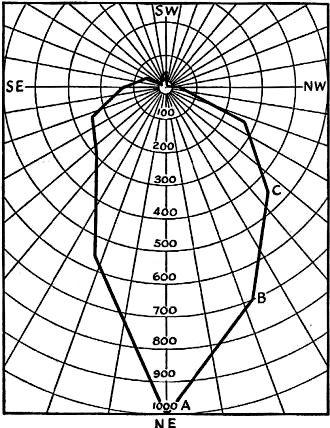
Fig. 3 - A sample rotary-beam directional characteristic
determined by the method described in the text. The curve could be smoothed out
if desired.
Obviously the only additional work necessary for plotting the radiation pattern
of a beam is to take a number of readings as the antenna is rotated, instead of
just the two needed to check front-to-back ratio. There are several precautions
to be taken in such checks, however, and the procedure followed at W2JCR may prove
helpful.
The first thing is to determine the antenna position which puts the strongest
signal into the receiver. If this is above S9 the antenna coupling to the receiver
should be reduced so that the meter reads S9 or slightly lower, thus keeping within
the range of the db calibration. Having found this position for the beam, and with
the receiver antenna coupling suitably adjusted, the exact course of procedure is
then agreed on between the two stations: The beam to be rotated in steps of not
more than 22 1/2 degrees and to be stopped in each of these positions for at least
30 seconds; at each stop the position of the beam to be announced, then the carrier
left unmodulated for the balance of the period.
At the receiver end the selectivity should be high to reduce the possibility
of QRM, because an interfering signal will make the check valueless. Leaving the
antenna coupling at the adjustment mentioned above, at each position of the beam
make a note of the announced direction, then during the unmodulated period make
sure the signal is exactly in tune and note the resulting reading. This retuning
is important because changes in signal strength may otherwise tend to throw the
receiver oscillator slightly out of tune, making readings unreliable. If modulation
were present, that too might confuse the readings by "wobbulating" the meter.1
The meter readings are noted in fractional S points; usually it is possible to estimate
to one-tenth of a point.
Table I is the work-sheet of an actual check made by W2JCR and will be briefly
described to illustrate the orderly method of recording the measurements and compiling
the desired data.
The directions as announced were entered in column 1 and the S readings in column
2. The transmitting station was then asked to stand by for a few minutes while the
desired information was worked out in columns 3, 4 and 5.
In column 3 the db values for the various readings are noted. These are taken
from the second column of Fig. 2. We note that the lowest value here is 15
db, and inasmuch as we are interested only in the relative values shown by this
particular beam we adopt this as a new zero level and deduct 15 from each of the
values in column 3, entering the result in column 4. From these figures we see that
the maximum signal is 30 db above the minimum; that the "head-on" signal is 13 db
above the back (southwest) signal, etc. Incidentally, we note that this beam is
apparently not functioning "according to Hoyle" because it should have minimum radiation
off the ends, which would be the SE and NW positions.
In this particular report the power ratios are entered in column 5. Had the owner
of the beam been interested in voltage ratios these would have been shown instead.
In either case the data are obtained directly from Fig. 2. If a power unit
value of 1 is given to the minimum signal position, then the maximum signal, which
is 30 db up, would represent 1000 times this power, etc.
With these figures completed a detailed report was given to the owner of the
beam by reading off to him the figures of columns 4 and 5. Later, as a matter of
interest, the pattern of his beam was drawn up as shown in Fig. 3, using polar
graph paper.2 Lacking this it could have been drawn on plain paper on
which a dot is first placed to represent the transmitter and lines drawn radiating
from this at angles of 22 1/2 degrees - like the cuts of a pie that has been divided
into 16 pieces.
The scale selected for use depends on the ratios involved. In this case the maximum
is 1000 to 1, so the scale used was 200 per inch, making the front lobe 5 inches
long. The other values were laid out on each of the lines corresponding to the beam
positions and the resulting points were joined together with a line and this made
up the pattern of the beam.
Had more readings been taken, perhaps at every 10 degrees, this pattern would
have been less angular in appearance and more truly representative, because obviously
the actual radiation pattern is not likely to have sharp points such as those shown
at the front and back. Even in drawing the present pattern it would have been entirely
legitimate to round off the corners; in fact this is usual practice although it
is easier to draw as shown in Fig. 3.
Attention has been centered, in this discussion, on the use of the S meter and
the data of Figs. 1 and 2 as aids in checking beams. But they have other applications
as well. Power gain or loss for different degrees of antenna coupling at the transmitter,
and different adjustments of the transmitter or transmitting antenna can be checked
in the same way providing the" before and after" readings are made under similar
conditions of receiver adjustment, line voltage, etc. The effectiveness of any two
fixed transmitting antennas can likewise be determined, especially if they are so
arranged that the transmitter can be switched from one to the other quickly. Such
comparative checks obtained from several receivers located in different directions
from the transmitter will provide helpful information, but the radiation pattern
of a fixed directional beam can be determined in this manner only if the antenna
used for comparison is non-directional or of known directional characteristics.
In conclusion, it is well to emphasize the fact that measurements such as those
described in this article are not perfect. The human element plays an important
part, as in accurately reading the meter, determining the exact angle between different
positions of a beam, etc. A bad tube in the receiver may alter the meter calibration,
but fortunately many of the ailments to which receivers are at times heir, while
they may change the reading of the meter for a given signal voltage input, do not
materially alter the relationship within the scale itself and therefore do not change
the db calibrations given in Fig. 1. In any event, the system outlined represents
the most accurate, generally available method of checking and is far superior to
the old system of "three S's down," "two S's up" now in common use.
In plotting radiation patterns it should be borne in mind that two patterns plotted
on the same beam but by different receivers in different directions will not necessarily
be the same. There are numerous factors, such as reflection, absorption, and refraction,
which may differ in different directions and different locations. But by obtaining
checks from several different stations it is usually possible to strike some sort
of average which will not only indicate the characteristics of the beam but may
indicate specific faults such as a nearby structure which is affecting its operation.
* The NC-100 utilizes an electric eye in conjunction with the r.f. gain control,
which has a 0-10 scale. With a signal tuned in the gain control is backed off until
the signal barely registers on the eye, then the S reading is taken from a curve
plotted in terms of gain-control settings. The combination is therefore the equivalent
of a meter.
** The Super-Pro meter is not calibrated in S-points but instead has a 0-5-milliampere
scale. With the antenna disconnected and no signal tuned in this will read somewhere
around 4. As signals are tuned in the reading drops and it is the amount of this
drop from the normal no-signal level that appears in the figure. Thus if the normal
level is 4.1 and a signal drops it to 3.6, then that signal is 15 db above the "zero"
level, etc.
1 Obviously, when making such a check with a distant station, it is also necessary
to take the effects of fading into account and, if necessary t make the measurements
over a sufficiently long period so that fading averages out. The measurements in
such a case should be attempted only when conditions are relatively stable. - Editor.
2 Polar Coordinate paper No. 358-31. Keuffel and Esser, 127 Fulton St., N. Y.
C.
Posted August 5, 2022
(updated from original post
on 3/31/2016)
|