|
Any problem involving proportion can be solved graphically without much difficulty.
Such problems occur often in a serviceman's and experimenter's life; therefore,
the chart, presented this month should prove applicable in many cases.
For instance, one can use any milliammeter as an ohmmeter but then it takes a
little arithmetic to find the resistance after readings are taken. This arithmetic
will be eliminated when using the chart in Figure 5. The chart can also be applied
to the slide-wire bridge, a construction is given for an ohmmeter scale employing
a milliammeter in the two popular circuits.
In the February 1932 issue of Radio News, the formulas for the different kinds
of charts were derived and here the N-chart was introduced. It consists of three
linear scales in the form of an N or a Z and is useful in several kinds of proportion-problems
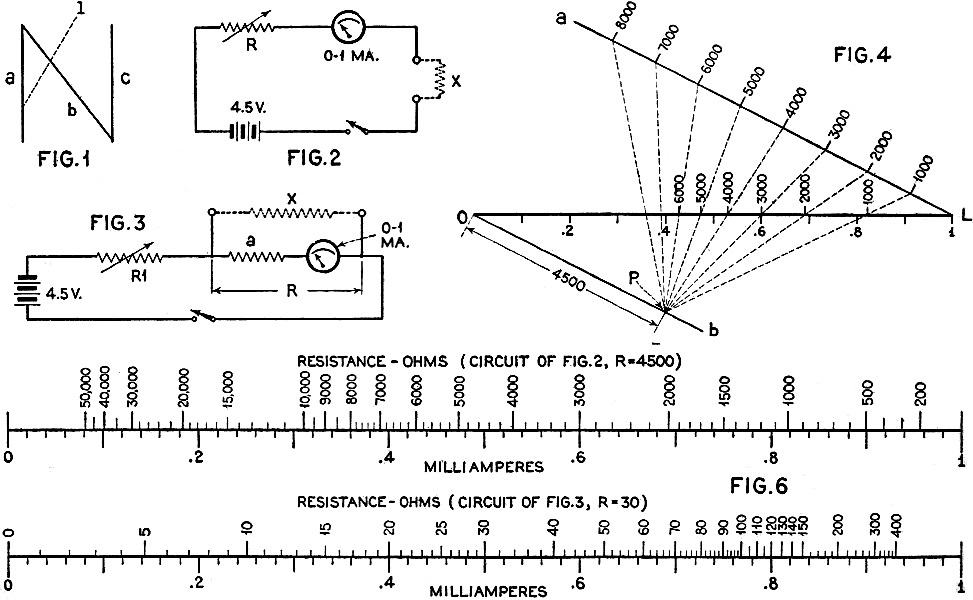
and some forms of multiplication. As seen in Figure 1, the chart has the drawback
that it is hard to utilize the extreme end of the diagonal scale since the line,
1, does not intersect scale c within the limits of the paper. In some cases, it
will be found that nearly one fifth of the scale b on each end cannot be used. Therefore.
instead of using the N chart, a logarithmic arrangement was used in Figure 5, even
though this meant the calculation of a special scale. It solves the same formula
as the N chart.
Now let us proceed with the problem. The ordinary ohmmeter is usually something
like the circuit in Figure 2. The 0-1-ma. meter is the most popular, and therefore
it is used here in the examples, but any milliammeter can be used. In fact. for
low-resistance measurements, an 0-50 m. meter is very useful. R is usually made
so that the meter shows full-scale reading when the test prods are short-circuited.
This, too, is not essential, but it is desirable since it gives a longer scale and
it simplifies computation. Suppose that we have such an ohmmeter, in which the meter
shows full-scale deflection when the prods are short-circuited, and that it shows
a lower reading, m, when the resistance x is inserted. Then,

Here the numeral 1, represents the full-scale reading (1 ma.) If a different
kind of meter is used with a full scale reading of n ma., then,
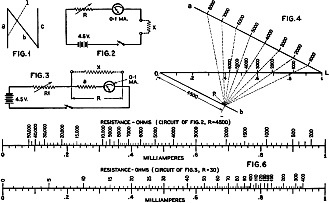
Referring to the chart of Figure 5, connect the meter reading on scale M (A)
with the value of R on scale R and the intersection on scale X shows the value of
the unknown resistance. For instance. if, as in our case, R is 4500 ohms and the
meter went down to .2 ma. with the resistance X inserted, then the sample line shows
that the resistance of X is 18000 ohms.
All you have to know is the value of R. This is the resistance which will let
just enough current flow to make the meter show full-scale reading. It can be figured
out with Ohm's law. With a 1-ma. meter and a 4.5-volt battery, R is 4500 ohms. With
a 10-ma. meter and a 4.5-volt battery it would be 450 ohms and with a 1-ma meter
and a 1.5-volt battery it would be 1500 ohms, etc. The range of such an ohmmeter
is from 1/10 R to 10R. It is possible to obtain some kind of reading above and below
this, but they are not accurate.
The second type of ohmmeter has the advantage of being especially suited to the
measurement of low resistances without drawing a very heavy current. This is illustrated
in Figure 3. The unknown resistance is shunted across the meter, which also makes
the meter go down from full-scale deflection. For higher resistances it may be placed
across the meter, plus a resistance, a, in series with it. The sum of a, and the
resistance of the meter we shall call R. Then the value of X is

where m is the reading of the meter with X connected to the test prods and n
is the reading when the test prods do not touch each other. The same chart (Figure
5) can be used again, but for this type of ohmmeter use scale M (B). The sample
line shows that if the meter went down to .8 mils and the resistance of the meter
was 45 ohms, the resistance of X would be 180 ohms. You can extend the ranges of
R and X by adding or subtracting the same number of zeros to both.
|
Electronics Nomographs and Circuits
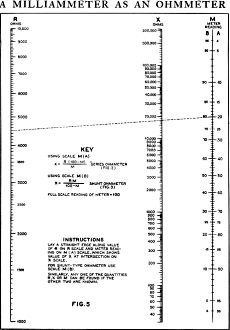
Figure 5 - A Millimeter as an Ohmmeter
A scale can be constructed for a given ohmmeter rather easily. This is illustrated
in Figure 4. Line L represents the scale on the meter. The same divisions and numbers
should be put on it. Then, in order to get the ohmmeter divisions, draw two lines,
a and b, through the ends of the scale at any convenient angle as shown, a and b
are parallel. On a, regular divisions are set off representing ohms, on any convenient
scale. Next you should find a point P on scale B so that OP equals R when measured
in the unit employed on a. Then draw lines from P to the divisions on a. The intersections
give the divisions for the ohmmeter scale on L. This construction is good for the
series ohmmeter (Figure 2) only. For the shunt type, the divisions of a should be
put on b instead and the point P should be taken on a in the same manner as before.
It will be found difficult to get to both ends of the scale with just one position
of P. After some divisions have been made with P in one position, the point can
be shifted, which means that you are using another measuring unit on both line a
and b. It will be found that the scales obtained by this method, for the ohmmeter
of Figure 2, resemble those for Figure 3 if R is the same; only, they are mirror
views of each other. When another range is required, it can be done by making R
twice as large (or 10 times as large) and then multiplying the readings of your
previous scale.
In Figure 6, two examples of completed scales are given. One is for a 0-1-ma.
meter in the series circuit with a resistance of R equals 4500 ohms. Its range can
be extended by employing a resistance of 45000 ohms and a 45-volt battery. Then
the scale readings should be multiplied by 10. The other scale is designed for an
ohmmeter of the shunt type, employing an 0-1-ma. meter with an internal resistance
of 30 ohms. If your meter is somewhat less than 30 ohms you should connect some
resistance in series with it so as to make the total 30 ohms.
Shunting the meter with a 3.3-ohm resistor will make the scale lower, multiply
all values with.1. When your meter has a resistance of 50 ohms (such as the universal
meter) all scale values should be multiplied by 5/3 or 1.67.
|