Practical Techniques of Square-Wave Testing |
|
If you work with oscilloscopes on a regular basis, you know know one of the first things you do (or should do) is to calibrate the frequency response of the probe by hooking it onto the squarewave port and tweaking the probe capacitor for no overshooting or undershooting at the waveform edges, and then verify that the displayed amplitude is correct. I remember being amazed during engineering courses at learning that any periodic waveform can be described mathematically as the sum of sinewaves at various frequencies, amplitudes, and phases. Knowing the theory behind those waveforms - particularly standard ones like squarewaves, trianglewaves, sawtooths, etc. - really helps in understanding what you see on the o-scope and in troubleshooting problems. The same goes for interpreting the impulse and step function responses as influenced by resistance, capacitance, and inductance effects. Perhaps the most amazing thing I learned about squarewaves is that, based on the Gibbs phenomenon, anything short of an infinite series of additive sinewaves when representing a squarewave results in an overshoot - albeit vanishingly minute - at the edge. In the real world, complex reactive/resistive effects render the effect undetectable. Practical Techniques of Square-Wave Testing
Fig. 1 - A square wave (1) is made up of fundamental sine wave (2) and odd harmonics (3). By E. G. Louis A square-wave generator and an oscilloscope are useful tools in designing and servicing wide-band amplifiers. What troubles to look for with certain scope patterns. By means of a Fourier analysis it is possible to show that an "ideal" square wave, Fig. 1 (Curve 1) consists of a fundamental (Curve 2) sine wave whose frequency is equal to that of the square wave, together with the 3rd (Curve 3), 5th, 7th, 9th, and higher odd harmonics, the amplitude of each decreasing in direct proportion to its order. Theoretically, a perfect square wave consists of a fundamental together with an infinite number of higher odd-harmonic signals.If such a square-wave signal is applied to the input of an electrical circuit, whether a filter network, amplifier, or other system, and the system does not respond equally well to the fundamental and all higher harmonics, then the output signal obtained will be distorted in a fashion indicative of the response characteristics of the system under test. This is the basis of the square-wave test technique. Since not only the fundamental, but all higher harmonics are applied simultaneously, and an indication of the system's response to this wide range of signals is obtained at once, square-wave testing provides an extremely rapid method for checking such network characteristics as frequency response, phase shift, transient response, etc. Because of the speed with which the square-wave test technique can be applied and information obtained, this method becomes quite valuable not only as an aid in the production testing and servicing of electronic equipment, but can be applied with equal, if not greater, value to the requirements of the practical design engineer.
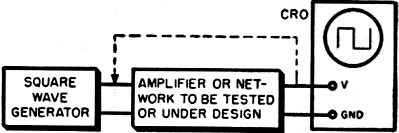
Fig. 2 - Setup for square-wave tests.
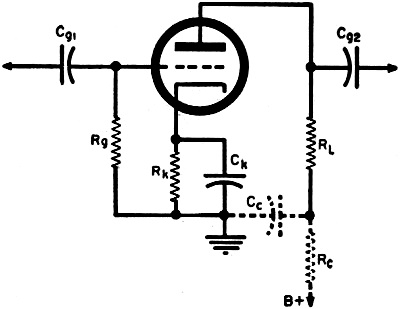
Fig. 3 - Basic triode amplifier circuit. In the past, the technique of square-wave testing has been confined largely to testing high-fidelity audio amplifiers and wide-band amplifiers with a bandwidth of perhaps several hundred kilocycles or 1 megacycle. With wide-band oscilloscopes now commercially available at prices within the reach of even the moderate sized experimental laboratory, and with square-wave generators on the market delivering square waves with fast rise times to frequencies as high as 1 megacycle, this valuable and easily applied technique can be applied to a very much greater extent. It may be used for checking not only audio amplifiers, transformers, and similar systems, but also for the check and design of wide-band scope and radar amplifiers, video amplifiers, and similar wide-frequency-range networks. Since the techniques of square-wave testing and analysis can be applied in the same fashion irrespective of the end result in view, whether servicing, design, or production test, we will try to simply outline the basic technique, with the major emphasis on the application of the technique in the design and service of wide-band amplifier circuits. Equipment Required Fundamentally speaking, only two pieces of equipment are required to apply the square-wave test technique, a square-wave generator and an oscilloscope. The square-wave generator may consist of a sine-wave generator and a suitable clipper amplifier where audio circuits and comparatively narrow-band circuits are to be checked. Where the response of video amplifiers and similar wide-frequency-range systems are to be checked, however, it is best to obtain a specially designed square-wave generator. In general, the square-wave generator should deliver perfect square waves with a short rise time at frequencies from the lowest frequency response of the system to be studied to a frequency one-tenth the highest frequency response of the system. For practical laboratory work, a square-wave generator delivering signals from 50 cps to about 500 kc. or 1 mc. with a rise time of at most .1 microsecond (and preferably less) will be found suitable. These signals may be available over a continuously variable range, or only at four or five "spot" values within this range. The output voltage should be easily varied from under 1 volt to at least 8 to 10 volts. Output impedance should be low, 600 ohms is about the highest that can generally be tolerated, particularly at high frequencies. The oscilloscope used must have characteristics that are superior to the system under test. From a general viewpoint, its vertical amplifier should be fiat below the lowest frequency square wave to be used in testing to a frequency ten times higher than the highest frequency signal to be used (within 1 or 2 db). It should not, in itself, cause any appreciable tilt or overshoot to any square-wave signal applied to its input within the range to be used for test purposes. The vertical amplifier should have a sensitivity of at least .5 volt/inch (peak-to-peak) and preferably more. A linear time base should be available within the scope which permits observation (with expanded sweep if necessary) of one cycle of both the highest and lowest frequency square waves to be used in testing. Applying the Technique The basic set-up used for square-wave testing is illustrated in block diagram form in Fig. 2. A square-wave signal is applied to the input of the system to be tested, and the input and output signals observed on a cathode-ray oscilloscope. Deviations from the original square-wave shape indicate certain characteristics of the system under test. Test leads, both to and from the equipment, should be as short as possible, otherwise, with high-frequency signals, or signals with a short rise time, unnatural peaking and overshoot may be introduced due to resonance in the connecting leads themselves. The output signal should be observed a a point where the loading of the CRO will not appreciably affect the circuit parameters. If a high-impedance, low-capacity probe is used with the scope, then individual stage characteristics can be observed. Limitations of Test Technique Since a square wave contains only a fundamental and higher harmonics, it is not ordinarily employed for checking the response of a system at frequencies lower than its fundamental value. The exception to this is the case of a network whose response is such that the fundamental of the square wave is changed in some manner with respect to its higher frequency components. Such a condition may cause a change in the square-wave shape indicative of the system's response at lower frequencies. Only odd harmonics of the square wave are present as part of the entire signal, hence any sharp dips or holes in the response characteristics of the system at specific frequencies falling between the odd harmonics may not show up in a square-wave test. However, the response of most amplifiers varies in a smooth manner and this limitation is minor. In general, a square-wave test will not indicate distortion due to overload or overdrive on an amplifier, unless the overload distortion varies with frequency. The square wave is simply made more "square," and a sine-wave signal still must be used for such tests. Finally, since it is almost physically impossible to produce a "perfect" square wave, and very difficult to detect changes in the square wave because of deterioration of signals higher than the tenth harmonic, square-wave signals should be available, and used, at approximately decade values. The exact number of signals required for a complete test will depend on the bandwidth of the system under test. From a practical viewpoint, signals of 50 cps and 1 kc. are suitable for testing usual amplifiers and transformers. For checking wide-band amplifiers generally used in the lab, frequencies of 50 cps, 1 kc., 10 kc. and 100 kc. may be used. For checking video amplifiers, signals of 50 cps, 1 kc., 10 kc., 100 kc., and 500 kc. may be used. Signals as high as 1 mc. may be used for checking special pulsing circuits. Response to L. F. Square Waves
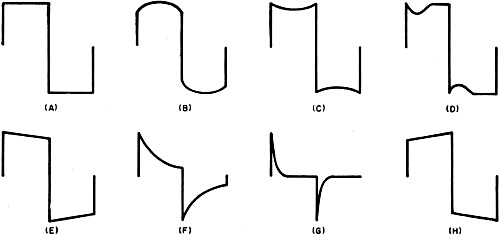
Fig. 4. Typical patterns obtained with low-frequency square wave applied.
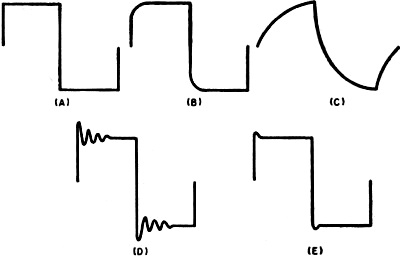
Fig. 5 - Square-wave patterns that may result from circuit deficiencies at the high frequencies with a good square-wave input.
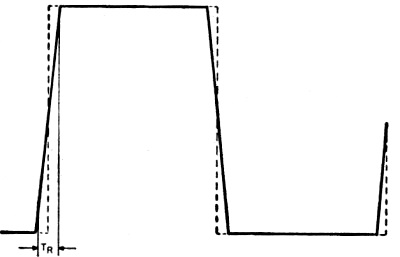
Fig. 6 - Illustrating rise time measurement on a square waveform.
Fig. 7 - Distributed capacities and inductances in basic amplifier circuit.
Fig. 8 - Series and shunt peaking coils compensate for high-frequency losses.
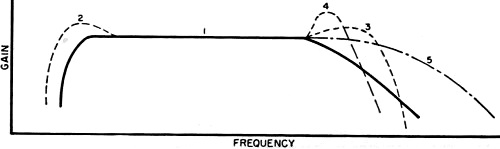
Fig. 9 - Basic amplifier response curves showing effects of compensating circuits. Typical patterns that may be obtained when a low-frequency square wave is applied to an amplifier or network are shown in Fig. 4. A basic triode, resistance-coupled amplifier age is shown in Fig. 3. If the amplifier responds perfectly to the input square-wave signal, neither attenuating nor accentuating the higher harmonics and causing no phase shift, a perfect output square wave will be obtained which, except for amplitude, is identical with the input signal, as shown in Fig. 4A. A boost at the fundamental frequency of the square wave with respect to it higher harmonics, but with no phase shift, will result in the rounded signal shown in Fig. 4B. Conversely, a loss at the fundamental frequency will result in a general dip in the square wave as shown in Fig. 4C, while a dip in the response curve, causing a loss of a particular harmonic, will result in a dip at one or more points in the square wave, as shown in Fig. 4D. Leading phase shift at low frequencies, but without appreciable signal loss, displaces the fundamental with respect to the harmonics, resulting in a tilted square top as shown in Fig. 4E. This is generally due to too low time constant in the RC coupling network (Cg1-Rg in Fig. 3). If a loss of signal accompanies the phase shift, then the flat top will curve downward as well as be slanted, as shown in Fig. 4F. An extreme case of too low a time constant in the coupling network may cause differentiation of the signal, allowing only the higher harmonics to pass and resulting in a peaked signal as shown in Fig. 4G. Such a signal may also be obtained due to high-frequency leakage around an attenuator circuit. Where low-frequency compensation is added to the amplifier stage (Rc-Cc in Fig. 3), overcompensation may result in the phase lagging at low frequencies, causing the square wave to tilt in the opposite direction, as shown in Fig. 4H. Irrespective of whether leading or lagging phase shift causes the square wave flat top to tilt (Figs. 4E or 4H), the amount of tilt depends on the degree of phase shift. A 10% slope will be obtained when the phase shift is 2° at the fundamental frequency of the signal. From a design viewpoint, conditions shown in Figs. 4E, 4F, or 4G generally indicate (in Fig. 3) either that Cg1 or Rg, both, should be increased in value, that Ck should be made larger, or that insufficient low-frequency compensation has been added. This, in turn, means that either Cc should be made smaller or Rc should be made larger (with respect to RL). If the condition shown in Fig. 4H is obtained, then the amount of low-frequency compensation should be lowered, by either reducing the value of Rc or increasing the value of Cc. From a servicing viewpoint, conditions indicated in Figs. 4E, 4F, or 4G generally indicate (again in Fig. 3) either that Cg1 or Rg has become lower in value (usually Cg1 will have partially opened ... fully open would result in Fig. 4G); that Ck has lost capacity, that Cc has increased in capacity (unlikely) or that Rc has dropped in value (which may happen due to overload). The condition of Fig. 4H indicates, generally, that C. has lost capacity or developed high power factor. It may also indicate that Rc has increased in value, but this is not very likely. The response of the amplifier to both low- and high-frequency signals must be considered before a full analysis of circuit operation can be made. Both tests, when taken together, give a much better picture of conditions in the system under test. Response to H. F. Square Waves Circuit deficiencies at high frequencies may result in any of the patterns shown in Fig. 5 (and even in some of those shown previously, particularly as far as phase shift is concerned). A typical single-stage, RC-coupled triode amplifier is shown in Fig. 7, together with some of the factors affecting its response to high frequencies. As in Fig. 4A, the "perfect" signal is shown in Fig. 5A. A loss of higher frequency harmonic signals will result in a rounding of the leading edge of the square wave as in Fig. 5B. The degree of rounding is dependent on loss of high frequencies, and an extreme loss will result in the output square wave approaching a sine wave in form. If almost all higher harmonics are lost, the square wave may appear as in Fig. 5C. Resonant circuits in the amplifier (or in the connecting leads) may cause "ringing" and result in damped oscillations on the leading edge of the square wave, as shown in Fig. 5D. The frequency at which the oscillations occur can be determined approximately by multiplying the number of "cycles" that would be present along the flat square top of the signal (if not damped) by twice the fundamental frequency of the square wave. Where rapid damping occurs, or where the resonant frequency is extremely high, only a small "overshoot," as shown in Fig. 5E, may be obtained. Since the rise time (time for square wave to go from 10% to 90% of its peak value) is dependent on the number of higher harmonic signals present without attenuation, this serves as a good indication of uniform frequency response of an amplifier or network irrespective of whether rounding of the square wave occurs or not. An increase in rise time in a square wave is shown in Fig. 6. A simple relationship, accurate enough for most practical design work, between rise time and uniform frequency response of an amplifier, is as follows: Maximum f (uniform response in mc.) = 1/2TR where TR is the rise time in microseconds. (This relation holds true only where artificial means, such as peaking coils, are not used to shorten the rise time.) From a design viewpoint, conditions shown in Figs. 5B or 5C indicate that the high-frequency response of an amplifier is not sufficient. This can be improved by reducing the effect of distributed capacities shown in Fig. 7 by making RL as small as is practicable for the gain desired, and then by using series and shunt peaking coils, as shown in Fig. 8, to offset these capacities. To obtain reasonable gain with a low RL, it may be necessary to go to tubes having high mutual conductance. In such a case, the stage gain is equal to the product of the load resistance and tube mutual conductance. Distributed capacities are reduced by keeping leads short, parts and leads above the chassis, and using miniature parts where economically feasible. The inductance of the peaking coils is generally chosen so that resonance will occur with the distributed capacities in the circuit at frequencies higher than the highest frequency at which uniform response is desired in the amplifier. In better amplifiers, these coils are usually made adjustable so that each unit may be adjusted for best response for the individual distributed capacities in that unit. If these coils resonate at too low a frequency, or if insufficient damping (RS1 and RS2 in Fig. 8) is used, a severe overshoot may occur, or an oscillatory wave train may be set up, as shown in Fig. 5D. Often a slight amount of overshoot (about 5% maximum) is desirable, as it tends to shorten the rise time of the amplifier. Thus, the condition shown in Fig. 5E would not always be considered objectionable. A loss of higher frequency signals may occur if there is inductance in the electrolytic capacitor used for cathode bypass (Lck in Fig. 7), due to degeneration across Rk and the loss of gain at these frequencies. In practical design, this can be offset by bypassing the electrolytic with a small capacitor (around .005 μfd.), as at Ck1 in Fig. 8. From a servicing viewpoint, conditions illustrated in Figs. 5B and 5C may indicate that a peaking coil has become shorted or open (if shunted with a damping resistor) or that .-RL has increased in value. In some cases it may indicate an open in Ck1 (Fig. 8). The condition shown in Fig. 5D may seldom be encountered, but generally indicates that a damping resistor across a peaking coil has opened. The condition of Fig. 5B, at higher frequencies, together with the condition shown in Fig. 4H at lower frequencies, would indicate that Cc (Fig. 3) has become open or dropped in capacity. Thus, it is practical to use a combination of conditions to indicate a specific defect. Square waves, observed with a cathode-ray oscilloscope, provide an efficient and extremely rapid technique for testing and servicing systems designed to pass a band of frequencies. The technique can also be used to good advantage in design and production engineering, for adjusting circuits for proper operation, and for determining optimum values of components. The basic relationship between the frequency response of an amplifier or network and its effect on square waves can be obtained by referring to Fig. 9. A simple resistance-coupled amplifier may have the response shown in Curve 1. With this type of response curve, a low-frequency square wave will appear as in Fig. 4E; at middle-range frequencies, as at Figs. 4A or 5A; while a high-frequency square wave will appear as at Fig. 5B. If low-frequency compensation is added, resulting in a boost at low frequencies as shown in Curve 2, middle-range and high-frequency square waves will appear as previously, but low-frequency square waves will generally be tilted in the opposite direction as shown in Fig. 4H. With the proper amount of compensation, a perfectly flat-top low-frequency square wave may be obtained, but this is frequently difficult to maintain in production unless each unit is adjusted individually. When a peaking coil is used to provide a boost at high frequencies, the over-all response may appear as shown in Curves 3 or 4, depending on the frequency of peaking and the amount of damping. With a response as shown in Curve 3, a high-frequency square wave may appear as in Fig. 5E, while middle and lower frequency square waves will remain as previously. If the response is as in Curve 4, a high-frequency square wave will appear as in Fig. 5D, and a middle-range frequency square wave as in Fig. 5E. If high-frequency compensation is obtained by reducing distributed capacities, a high-frequency square wave can be made to approach the input signal in form, as in Fig. 5A, and the response curve becomes as shown in Curve 5. Note that the response falls off smoothly at higher frequencies. The same result can be obtained by reducing RL, but this results in reduced overall gain.
Posted December 7, 2022 |
|