|
|||||||||||||
 |
|||||||||||||
Solar Spectral Irradiance & PV Cell Operational Regions (ASTM G173-03) |
|||||||||||||
|
Derived from SMARTS v. 2.9.2* : ASTM G173-03
The chart below was created in Excel from numerical data obtained on the National Renewable Energy Lab (NREL) website. Although more extensive data is provided there, the values typically sought out for solar cell (photovoltaic cell, PV cell) are contained herein. The red line is referred to as AM0 (Air Mass 0) and is the radiation level outside of the Earth's atmosphere (extraterrestrial). The blue line is AM1.5 and is the radiation level after passing through the atmosphere 1.5 times, which is about the level at solar zenith angle 48.19°s, an average level at the Earth's surface (terrestrial). Some really smart people figured that out, so you just have to believe them. The region of the electromagnetic spectrum covering visible light is indicated by the color smear. Note on the right side of the chart that the 3,000 nm point is labeled as the equivalent of 100 THz, so this spectrum is a long way from the RF / microwave end of the spectrum. For a chart of the atmospheric absorption in that region, click here.
The AM0 data is also referred to as ETR, and the AM1.5 is referred to as Direct+Circumsolar ETR = Extraterrestrial Radiation (solar spectrum at top of atmosphere) at mean Earth-Sun distance. Direct = Direct Normal Irradiance Nearly parallel (0.5 deg divergent cone) radiation on surface with surface normal tracking (pointing to) the sun, excluding scattered sky and reflected ground radiation Circumsolar = Spectral irradiance within +/- 2.5 degree (5 degree diameter) field of view centered on the 0.5 deg diameter solar disk, but excluding the radiation from the disk * SMARTS2 version 2.9.2 is the model used to generate the American Society for Testing and Materials (ASTM) terrestrial reference spectra for ASTM Standard G-173-03 "Standard Tables for Reference Solar Spectral Irradiance at Air Mass 1.5: Direct Normal and Hemispherical for a 37 Tilted Surface".
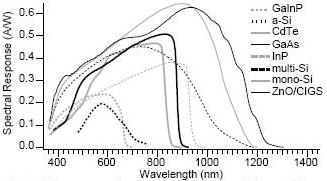
These spectrum response curves are from a chart in a report published by NREL: "Solar Cell Spectral Response Measurement Errors Related to Spectral Band Width and Chopped Light Waveform" They represent the most useful region of the electromagnetic spectrum for each type of semiconductor compound. Many modern cells are multi-layer structures that combine multiple compounds to harness a much larger portion of the available energy than would be possible with a single type of solar cell. |
|||||||||||||
 |
|||||||||||||
|
|||||||||||||


|
||||||||||||||||||||||||||||||||||||