|
September 1971 Popular Electronics
 Table of Contents Table of Contents
Wax nostalgic about and learn from the history of early electronics. See articles
from
Popular Electronics,
published October 1954 - April 1985. All copyrights are hereby acknowledged.
|
Prior to the availability
of high speed semiconductor circuitry, there was not enough computational power
available - particularly in airborne platforms - to perform a significant amount
of real-time signal processing in radar systems. Analog methods were available to
do things like stationary target cancellation (moving target indication, MTI) and
noise reduction to eliminate clutter on the plan position indicator (PPI, aka radar
scope), range and azimuth blanking of selected regions of the scan, signal discriminators
and integrators, and false target elimination via pulse repetition rate (PRR) and
pulse repetition interval (PRI). There was nothing, really, in the older vacuum
tube based systems to derive a target profile based on radar cross section (RCS)
and signal vector (amplitude and phase) processing. This 1971 article reported on
what was at the time information about very new technology that was just being made
available to the general public and was beginning to be integrated into civilian
radar systems. The waterfall plots of return signals included in the article were
likely the first such plots ever seen by most people. Nowadays, waterfall plots
are common features of spectrum and signal analyzers, and even on middle grade Ham
radio transceivers.
Are Modern Military Radars Infallible?

Far from it, but "Radar Signatures" are helping them find their
targets
By A. E. Judd.
Diversified Consultants
When asked what function a radar system performs, the normal response is, "Why,
it tells you where something is in relation to the radar antenna - the location
being described by an azimuth angle and a range in distance." That's true and in
most cases, it is all that one needs to know about a target.
However, as radar technology advances, it has been found that other useful information
about the target can be determined - specifically, something about the size and
shape of the target. This is important if you want to know whether you are watching
a single large bird, a flock of small birds, a small single-engined aircraft, a
large jetliner, or, in the extreme, a re-entering missile with a warhead.
During World War II, competent radar operators noticed that, with practice, they
could sometimes identify the type of target aircraft merely by observing the behavior
of the blips on the screen. There was "something" about the blip action that indicated
to the acute observer the difference between a single-engine fighter, a multi-engine
bomber, and a lumbering cargo carrier.

Fig. 1 - Standard radar trace has the "main bang" at the
leading edge and the target echo upscale. The system noise produces the "grass."

Fig. 2 - Typical printout shows variations in target return
for time after liftoff, altitude, and view angle. Note peaks at each second, indicating
spin, and narrow spike at 396.5.

This is a Luneberg lens made from layers of dielectric and conducting
material. Although a good radar reflector, it is very frequency selective and is
ineffective off frequency.
That mysterious something is now called "radar signature" or, more popularly,
"radar cross section". The characteristics of the target which have an effect on
the returned signal and contribute to its cross section are: its length and diameter
with respect to the radar frequency; its vertical and horizontal polarization with
respect to the signal; its exposed area; the material from which it is made (metal
produces a stronger return than plastic); its attitude (tumbling, spinning, or proceeding
in a straight line); and its wake (ionized, plasma, or none at all). Of course,
the characteristics of the transmitted signal also affect the radar cross section
(RCS). These include polarization, view angle, and frequency.
The easiest way to visualize what produces a radar cross section is to imagine
the radar beam impinging on a metal sphere some distance away. Obviously, no matter
how the sphere is oriented, it always presents the same type of surface to the radar
signal and the return echo always has the same configuration when seen on an "A"
(scope type) screen, with the "main bang" at one end (start of trace) and the radar
return at some distance from the start. If the target has any other shape, then,
as it moves relative to the radar beam, the echo varies due to the different surfaces.
Thus, if a number of different shapes are used as targets (under controlled conditions),
it is possible to identify them by the characteristics of the displayed echo. Similarly,
the returns from various types of aircraft can be analyzed so it is possible to
determine their external physical characteristics. (Note that the radar cross section
can only be used to distinguish external characteristics, which makes the term somewhat
of a misnomer, but descriptive nonetheless.)
RCS Techniques
When a radar signal is received, it is usually displayed on an A-type trace and
looks somewhat like that shown in Fig. 1. The main bang is the signal representing
the transmitter pulse. Since the CRT usually has a greenish trace, the system noise
which follows is called "grass." The target echo is usually an undulating, complex
pulse whose instantaneous shape is a function of the target characteristics mentioned
above. Range is calculated from the distance between the main bang and the target
pulse, while the azimuth angle is determined by the pointing angle of the antenna
with reference to a fixed point, usually north.
At the same time that the signal return is being displayed, it is photographed
by fast cameras to record all the individual undulations that make up the complex
target pulse. This information is video recorded for later playback and detailed
analysis by a computer. This is accomplished by a programmable reader that samples
pulse amplitudes at equal intervals of the trace with the distance be-tween samples
dependent on the sweep speed of the display. During this processing, individual
points are automatically converted to equivalent power using special calibration
curves, and corrections for off-axis lobe pointing are inserted. After all of this
processing, the computer draws - through peripheral equipment - the radar cross
section.
Data Interpretation
Radar cross section is often measured in DBSM (dB per square meter), which is
plotted against time, altitude (slant range), and view angle between the antenna
and the target. An example of such a plot is shown in Fig. 2. Study of this
pattern indicates a long thin vehicle, having one or more protrusions. The vehicle
is spinning, thus producing the 5-DBSM peaks at each second. At about 396.5 seconds,
its narrowest end (smallest cross section) was presented to the illuminating radar.
Note also that the altitude is decreasing with time, indicating a re-entering vehicle
from a very high altitude.

Fig. 3 - When large numbers of traces are stacked up in
time, and leading edges aligned, computer readout appears like this. It is not known
for certain just what the little things off to the right side actually represent.
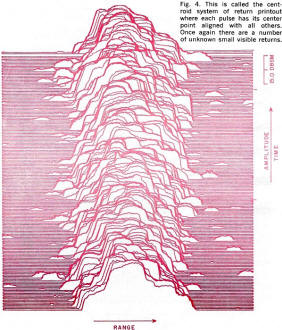
Fig. 4 - This is called the centroid system of return printout
where each pulse has its center point aligned with all others. Once again there
are a number of unknown small visible returns.
New methods of RCS investigation are being developed. Figures 3 and 4 are examples
of the latest developments. Figure 3 is a computer readout of data furnished by
a radar that employed leading-edge tracking. That is, the radar was locked on to
the leading edge of the return pulse. This data was created by programming a computer
to draw a picture of each return pulse, starting at the leading edge and aligning
all displayed pulses to that edge. Figure 4 was produced by a system using centroid
tracking - with the returns synchronized to the center of each pulse rather than
the leading edge.
Countermeasures
Today's military radar - airborne, gun or missile control, or ground interception
- relies heavily on the strength of the return signal to identify the size of the
target. During World War II, advance strike aircraft dumped massive loads of finely
cut aluminum strips (called "chaff") to blind the enemy radar to the following aircraft.
As the strips tumbled down, changing their orientation with respect to the radar,
random echoes were picked up, usually completely blanking out the prime targets.
In some instances, long rolls of aluminum foil (called "rope") were dumped out of
the lead aircraft, creating very large unpredictable echoes.
These tactics made it almost impossible for the enemy radar to get an accurate
fix on the attack flight. However, both approaches had some serious drawbacks. The
lead aircraft was always exposed to the radar; and with the development of range
gating, once the foil dropped a reasonable distance below the flight altitude, the
attack force could again be picked up on radar. Thus electronic countermeasures
were developed - including flying decoys.
Flying decoys - either small aircraft or electronic packages to simulate a missile
- are reaching a high degree of sophistication. In their role of deceiving the enemy,
decoys use various ways of changing the radar image: reflectors, Luneberg lenses,
tuned delay lines, traveling wave tubes, and active radar. The reflector tends to
produce a larger radar return than would be expected from a small flying object.
The Luneberg lens is made of layers of dielectric and conducting materials in the
shape of a large candy "jawbreaker." The lens is insensitive to the direction of
the radar beam, but unfortunately is very sensitive to frequency. Therefore, a lens
designed for one frequency is not effective at another.
The purpose of decoys carrying tuned delay lines, travelling wave tubes, or active
radar devices is to receive the main bang pulse from an enemy radar, modify its
shape to simulate a large aircraft, and fire it back, appropriately delayed in range.
Since this type of electronic equipment is small and lightweight, an attack aircraft
can carry many decoys so that, when they are released, the real aircraft is lost
in the profusion of apparently clean returns.
Another countermeasure approach uses sheer brute signal strength. The attack
aircraft carries a powerful transmitter, capable of operating across the known radar
bands, which locks on to a received signal and then sends it back to overwhelm the
enemy radar.
The advent of satellites and ballistic missiles has sparked an intensive investigation
of radar cross sections to permit identifying the intruder long before he can put
his countermeasure devices in operation.
Even with these latest approaches to RCS, we still do not have an accurate "photograph"
of the vehicle, but it is possible for the trained analyst to visualize the target.
As a point of interest, note that, in each of these computer-drawn displays, there
appear to be small radar-reflecting objects separated from the main body of pulses.
Although it is not absolutely certain, it would appear that these are either an
ionized wake (caused by the high velocity through the atmosphere) or fragments breaking
off the re-entering body.

Fig. 5 - Three types of commonly used methods of creating
radar cross section measurements. The target can be full size or scaled and is suspended
on lines that don't reflect the radar.
Making Measurements. There are two types of radar cross sections:
static and dynamic. The former are obtained under carefully controlled laboratory
conditions and include full- or partial-scale models in a static (non-changing)
environment.
Dynamic measurements involve studies in a free-space environment.
There are a number of static RCS ranges in the United States, operated by various
radar manufacturers and universities. The more sophisticated installations are called
"ground plane" ranges utilizing the radar energy that travels directly to the supported
target, as well as the energy reflected from the earth (Fig. 5A). If the height
and elevation of the radar antenna and the height of the target model are properly
adjusted, coherent phase addition of the electromagnetic fields occurs. Phase addition
can enhance the target returns over the free-space conditions, while suppressing
returns from objects near the earth's surface.
At some static measurement ranges, interference from the vicinity of the target
can be considerably reduced by mounting all metal objects (such as rotators, etc.)
below the surface and mounting the reflecting target on non-metallic supports that
produce a minimum of reflection at the radar frequency employed. At some ranges,
the receivers are range gated so that they accept only signals from a prescribed
"block" of space (where the target is located). This reduces background interference
from reflecting targets outside the target area. In some ranges, especially those
in the Western desert areas, the radar signatures of insects that accidentally enter
the range gate area have been measured.
There are three basic ways to "look" at a radar target: monostatically, bistatically,
and multistatically. A mono static system (Fig. 5B) has its transmitting and
receiving antennas at the same location - usually the same antenna. Thus, a transmitted
pulse going out to the target is reflected back along the same path to the receiving
antenna. In a bistatic system (Fig. 5C), the transmitting and receiving antennas
are separated, with the angle between the two beams called the bistatic angle. A
radar pulse in this system has a different characteristic from that of a monostatic
system.

This radar screen can present quite a problem. It is possible
that some of the targets are real aircraft, while the others are decoys that just
simulate aircraft.
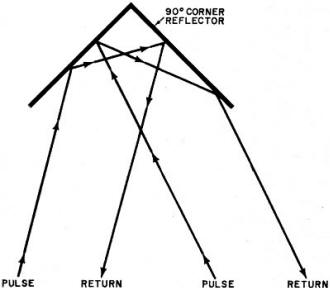
Fig. 6 - Theory of the corner reflector that illustrates
how this device returns the radar beam along same path on which it came.
A multi static system uses one transmitter and several receivers and usually
has such refined approaches as correlation techniques. This produces the effect
of looking at an object in "stereo," producing a much more realistic view.
Why use separate antennas just to achieve a different return? If the elementary
theory of cornet reflectors is reviewed, you will note that the energy impinging
on a corner reflector is returned along the same path to the source (Fig. 6).
Thus a mono static radar shows a greater cross section from a corner reflector than
does a bistatic type. This provides a method of discriminating between real missiles
and decoys having corner reflectors to enhance their RCS. One of the great advantages
of bistatic and multistatic radars is their ability to discriminate.
The Future of RCS. The resolution capability of radar is constantly
being upgraded. With the use of synthetic-spectrum radar, chirped radar, phased-array
systems, etc., the resolution should improve to the point where the image of a distant
target will correspond more to its physical than its electrical features.
The behavior of wake and plasma phenomena is becoming better understood as more
advances are made. Coupled with new approaches to computer printout, this should
provide displays of greater validity. The entire field of RCS in reentry physics,
radar profiling, passive radar detection, and large-scale air traffic control has
barely been opened.
Posted August 30, 2018
|