Cool Pic Archive Pages
| 1 |
2 | 3 |
4 | 5
| 6 | 7
| 8 | 9
| 10 | 11
| 12 | 13
| 14 | 15
| 16 | 17
| 18 | 19
| 20 | 21
| 22 | 23
| 24 | 25
| 26 | 27
| 28 | 29
| 30 |
These images have been chosen for their uniqueness. Subject matter ranges from
historic events, to really cool phenomena in science and engineering, to relevant
place, to ingenious contraptions, to interesting products (which now has its own
dedicated Featured Product
category).
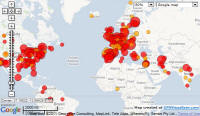
Researchers
Lutz
Bornmann and Loet Leydesdorff recently published a paper whose results are maps
displaying the relative numbers of science papers each city of origin has cited
by other science papers. Chemistry, physics, and psychology categories are given.
A detailed explanation of how the maps are generated is provided, including how
circle sizes are calculated and how colors are assigned, based on statistical analysis.
If the observed value is greater than the
expected value,
green is assigned. If the observed value is less than the expected value, red is
assigned. Where is that huge red circle? Moscow. Its size means the number of published
papers from Moscow relative to the number of papers that cite those papers is high;
i.e., Muscovites do a lot of writing citing other sources, but not many writers
cite papers from Muscovites. A big green circle is what you really want - like Cambridge,
Mass. (not Cambridge, Idaho, as plotted), which is
home to MIT, Harvard, and U. Mass, as well as many high-tech, highly published companies
like Raytheon and Skyworks. Other big producers in the U.S. are Chicago/Urbana,
Ill. (Motorola, Fermilab), and Berkely (Silicon Valley). In Europe, London (Cambridge
U.) is the stand-out performer, with Paris, France, and Munich, Germany, following.
Hefei, China, with three national physics laboratories, beats out even Hong Kong.
The Tokyo region of Japan dominates the Pacific island realm, while Singapore rules
SE Asia. It is worth taking a couple minutes to read through the paper ("Which
cities produce worldwide excellent papers more than can be expected? A new mapping
approach—using Google Maps—based on statistical significance testing") to learn
how the creators arrived at the maps.

Map of Cities with Largest
Number of Cited Physics PapersView original map at
hhttps://www.leydesdorff.net/topcity/figure1.htm
I tried using the provided data file at
https://www.leydesdorff.net/maps/inp_gps.txt
as input for the GPS Visualizer program from Google, but the result (see below)
was not what is presented by the authors... so I gave up.
|