|
 |
RF Cascade Workbook 2004 User's Guide© - Chapter 5 |
| Chapter
1, 2,
3, 4,
5,
6, 7,
8, 9,
10 |
Version 1.01 by Kirt Blattenberger RF Cafe Website
(www.rfcafe.com) |
Chapter 5 |
5 Component RF
Specification |
| Block Diagram |
| Click on the component icon to be changed (see Figure 9) to open the window in Figure 6. If
the window covers the component you are changing, move it out of the way. Click on the radio button of the
image you want to appear for the component - it will update the block diagram while the window is open. Click
on Close when you are finished. |
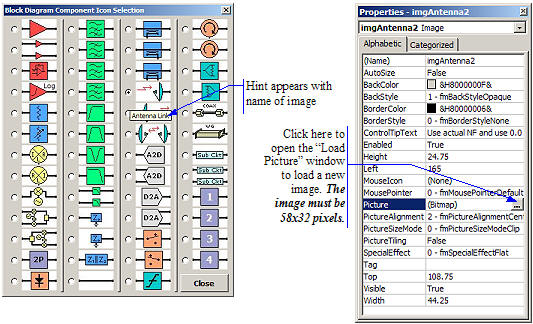 |
| Figure 6 Component Icon Window Figure 7 Image File Load
Window |
| Four component images are reserved for user-assigned images, although any or all of the images
may be modified to suit user needs. To assign a new image to an icon open the VBA code window, right click on
the image and open the Properties window, then click on the button shown in Figure 7. Note that the image file
needs to be 58x32 pixels in order to properly fill the space of the VBA Image holder object. You can of course
change the image file size, but modifying the Image component size in the workbook will also be necessary. |
| Note on Antenna Components |
| Antennas must be specified with care in a cascade analysis. Assigning a gain value will result
in an incorrect calculation of all parameters that involve gain, which is just about everything. Antennas do
not provide “real” gain insofar as they do not actively amplify the signal level; their gains are expressed
relative to an isotropic radiator (hence the “dBi” unit). Placing an antenna at the output of the system will
work well since its presence does not affect any calculations after it. The best way to model an antenna at
the input of a system in RF Cascade Workbook” is to set the gain equal to zero, and add the antenna gain to
the P[input] value that is located to the left of the chart area. Noise figure and intercept points may be
entered normally. When a pair of antennas (an AirLink) are inserted within the cascade, all calculations up to
the first antenna will be valid, but only gain and power levels will be valid past the antenna for the reason
stated above. |
| Parameters |
| Each component is specified in a manner similar to what is shown in Table 2. Figure 9
identifies each of the special features in the worksheet, so please review it carefully before proceeding.
Note that due to the new layout of the component parameter input cells, it is not possible to simply copy and
paste from a previous version or RF Cascade Workbook into this one. It will be necessary to retrieve the
nominal and tolerance values individually from the worksheet of previous versions. All cell input data is
validated for correctness. |
| A description of, and allowable input range for, each component parameter is given in Table 2.
Limits have been set using the “Data-->Validation…” menu selection (Figure 8), and may be changed by the user.
Keep in mind if you decide to increase the limits on dB values (although it is hard to imagine why the need
would arise) that the VBA functions use double precision numbers with a maximum value of around 10308, so
values like NF, IP2 and IP3 that need to be converted from decibels to linear numbers during calculation could
exceed the limit and cause an error to display in the cells. |
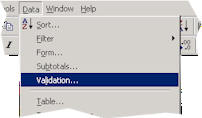 |
| Figure 8 Data Validation Menu Access |
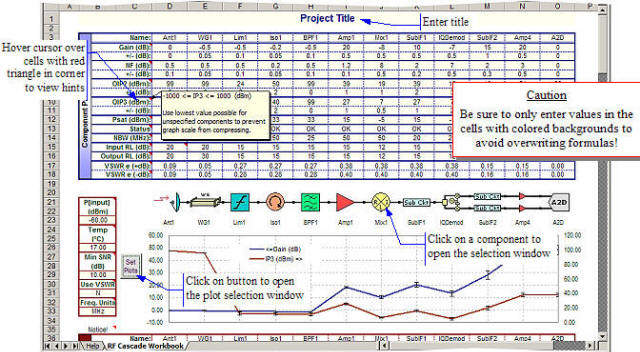 |
| Figure 9 Component Specification Input Area |
| Parameter |
Description |
Range |
Tolerance |
Units |
| Name |
Descriptive name for component |
- |
- |
- |
| Gain |
Linear power Gain |
-1000 to +1000 |
-1000 to +1000 |
dB |
| NF |
Noise Figure |
0 to +1000 |
0 to +1000 |
dB |
| IP2 |
2nd-Order Intercept Point |
-1000 to +1000 |
-1000 to +1000 |
dBm |
| IP3 |
3rd-Order Intercept Point |
-1000 to +1000 |
-1000 to +1000 |
dBm |
| P[sat] |
Saturated Power |
-1000 to +1000 |
-1000 to +1000 |
dBm |
| Status (this is not an input) |
Displays alert for the following conditions: N = A negative value is entered in the Gain cell, but
the NF is not equal to the absolute value of the Gain. S = The input power plus linear Gain
results in an output power greater than the saturated power for the component. T = Tolerance
is greater than ±Gain/2 or ±NF/2 |
- |
- |
- |
| NBW |
Noise Bandwidth |
10-12 to 1012 |
- |
Specified Freq. Units |
| Input Return Loss |
RL = |
10-3 to 100 |
|
dB |
| Input Return Loss |
10-3 to 100 |
|
dB |
|
| Table 2 Component Input Parameters |
| Excel's ability to split the screen into two regions within the same worksheet can be used to
enable “bypassing” the chart area to be able to watch the calculated cascaded output values area (see Figure
10). Note that the original position of the screen splitting “handle” is in the upper right hand corner of the
display, near the farthest right column header. |
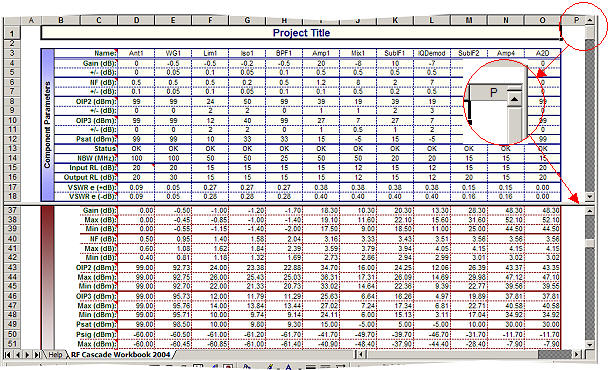 |
| Figure 10 Screen Spilt Horizontally |
Chapter
1, 2,
3, 4,
5,
6, 7,
8, 9,
10
|
Version 1.01 by Kirt Blattenberger RF Cafe Website
(www.rfcafe.com) |
Chapter 5 |
|
|
|
|
|