| This section presents all of the formulas used in the VBA functions to calculate system
cascade parameters. In the following equations, the subscript “N” refers to the current stage component
parameter, while “N-1” refers to the cascaded system parameters up through and including the previous stage.
Use Figure 12 as a reference when interpreting the formulas. For example, GainN refers to the gain
of the current stage's component. GainN-1 refers to the cascaded gain of all stages preceding the
current stage. So referring to Figure 12, for N=3, ComponentGainN = 20 dB, and NomGainN-1
= -5 dB. Finally, upper case names refer to decibel values (e.g., 20 dB or 20 dBm), while lower case names
refer to linear values (e.g., x100 or 100 mW). |
| Min/max formulas are constructed using only combinations that can occur based on the available
combinations of parameters, rather than just those combinations that yield absolutely the largest and smallest
values. For instance, the maximum IMD3 value uses the cascaded values of MaxP[sig] and MaxIP3 because both use
MaxGain. Note: The user must decide whether the parameters used for the Min/Max values are representative
of his system, and make modifications as necessary. |
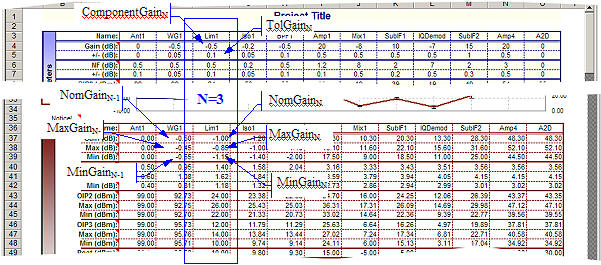 |
| Figure 12 Formula Reference Designations |
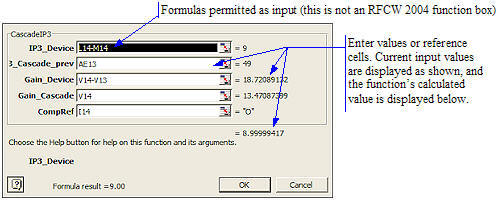 |
| Figure 13 Function (fx) Dialog Box |
Convert between decibels and non decibels as follows:  |
| 7.1 Interstage VSWR Mismatch Error (dB) |
| VSWR mismatch errors are caused by constructive and destructive interference of the voltage
standing waves at component interfaces due to impedance mismatches. This is NOT the sum of all VSWR errors
(see VSWR Mismatch column and right end of worksheet for cumulative). It is assumed that there is infinite
isolation between the component's input and output ports. These equations deal with voltage, so the “20*log10
(v)” decibel form is used. |
- Neg - |
- Pos - |
| 7.2 Gain (dB) |
| Gain values expressed in decibels add arithmetically for the linear operating region
(potential output compression is ignored). If the “Use VSWR” cell is set to “Y,” then the interstage VSWR
mismatch values are added to the total gain for Min and Max values. |
- Nom - |
| Nominal cascaded gain uses the sum of the nominal gains for each of the stages. |
|
- Max - |
| Maximum cascaded gain uses the sum of the maximum gains of each of the stages. |
- Min - |
| Minimum cascaded gain uses the sum of the minimum gains for each of the stages. |
| 7.3 Noise Figure, NF (dB) |
| Noise figure is effectively the reduction of signal to noise ratio from the cascade input to
the output. Noise figure must be calculated using the non decibel forms of gain and noise figure, and then
converted in decibel. These equations deal with power, so the “10*log10 (v)” decibel form is used. |
- Nom - |
| Nominal cascaded noise figure uses the nominal gains and noise figures of each of the stages. |
- Max - |
| Maximum cascaded noise figure uses the minimum gains and maximum noise figures of each of the
stages. |
- Min - |
| Minimum cascaded noise figure uses the maximum gains and minimum noise figures of each of the
stages. |
| 7.4 Output 2-Tone, 2nd-Order Intercept
Point, OIP2 (dBm) |
| IP2 is the theoretical power at which the 2nd order intermodulation products would intersect
the power of the original tones (CW) when input/output power slopes are plotted. In the linear region of
operation, the original tones plot on a 1:1 (normalized) slope, while the 2nd order products plot on a 2:1
(normalized) slope. Therefore, the product tones increase at twice the rate of the original tones, and the
lines cross at the IP2 point. |
| - Nom - |
| Nominal cascaded 2nd-order intercept point uses the nominal gains and IP2s of each of the
stages. |
| - Max - |
| Maximum cascaded 2nd-order intercept point uses the maximum gains and maximum IP2s of each of
the stages. |
| - Min - |
| Minimum cascaded 2nd-order intercept point uses the minimum gains and minimum IP2s of each of
the stages. |
| 7.5 Output 2-Tone, 3rd-Order Intercept
Point, OIP3 (dBm) |
| IP3 is the theoretical power at which the 3rd order intermodulation products would intersect
the power of the original tones (CW) when input/output power slopes are plotted. In the linear region of
operation, the original tones plot on a 1:1 (normalized) slope, while the 3rd order products plot on a 3:1
(normalized) slope. Therefore, the product tones increase at three times the rate of the original tones, and
the lines cross at the IP3 point. |
| - Nom - |
| Nominal cascaded 3rd-order intercept point uses the nominal gains and IP3s of each of the
stages. |
| - Max - |
| Maximum cascaded 3rd-order intercept point uses the maximum gains and maximum IP3s of each of
the stages. |
| - Min - |
| Minimum cascaded 3rd-order intercept point uses the minimum gains and minimum IP3s of each of
the stages. |
| 7.6 Saturated Power, P[sat] (dBm) |
| P[sat] is the output power at which no further increase in the input power will result in an
increase at the output. This is an extremely nonlinear region of operation and can only be modeled by
sophisticated transfer functions that are unique to each component. Therefore, no attempt is made to model it
here. Instead, the P[sat] value is used as a monitor for the power level in the system to alert the user to a
potential problem. A check is made to determine whether the power level at the component input, plus the
linear gain of the component, results in a power level equal to or greater than the P[sat] of the component.
If so, then the output power is limited to the component's P[sat] power level. No tolerance input parameter is
provided for P[sat] because it normally is not an intentional design parameter. |
| - Nom - |
| Nominal gain and P[sat] values are used per the following equation. |
| - Max - |
| Not used. |
| - Min - |
| Not used. |
| 7.7 Signal Power, P[sig] (dBm) |
| P[sig] is the power of the signal as it propagates through the cascade, and is increased or
decreased by the linear gain of each stage. Note that it is possible for the calculated value to exceed the
P[sat] value, because no adjustment is made. This is done to prevent the annoying case where all of the other
power dependant values are thrown off by an adjusted output power value. There is an indication of a saturated
condition given in the alert column labeled “Note.” |
| - Nom - |
| - Max - |
| - Min - |
| 7.8 Noise Bandwidth, NBW (MHz) |
| Cascaded noise bandwidth merely checks the NBW of the current component, and sets the system
NBW to the lesser of either the component NBW or the system's previous NBW. Only a nominal value is
calculated. |
| - Nom - |
| - Max - |
| Not used. |
| - Min - |
| Not used. |
| 7.9 Noise Power, P[n] (dBm) |
| P[n] is the power of the noise as it propagates through the cascade, and is increased or
decreased by the gain noise figure and NBW of each stage. Since the system temperature is given in Celsius
degrees, 273.15 is added to get equivalent Kelvin degrees. NWB is given in MHz, so a multiplication by 106 is
done. Note that MaxGain is used with MaxNF and MinGain is used with MinNF. This is because in most systems the
noise figure is set near the cascade input where the least amount of gain has accumulated. Your specific
application might warrant a different combination of Min/Max values. |
| - Nom - |
| - Max - |
| - Min - |
| 7.10 Signal to Noise Ratio, SNR (dB) |
| SNR is the difference between
the noise power level and the signal power level. |
| - Nom - |
| - Max - |
| - Min - |
| 7.11 Saturated Dynamic Range, SDR (dB) |
| SDR is the difference between the saturated power level and the noise power level, minus the
minimum system SNR, as specified in the system parameter area to the left of the chart. This is different
than the traditional dynamic range (DR), which references the 1 dB compression point (P1dB), since RF Cascade
Workbook 2004 does not calculate P1dB. |
| - Nom - |
| - Max - |
| - Min - |
| 7.12 2nd-OrderSpurious-Free Dynamic Range,
SFDR2 (dB) |
| SFDR2 is the theoretical power of two tones at the system input that would generate 2nd order
products at the output with a power just equal to the noise power at the output. |
| - Nom - |
| - Max - |
| - Min - |
| 7.13 Output 2nd Order Intermodulation
Product Power, OIMD2 (dBm) |
| Calculations of IMD2 in RF Cascade Workbook 2004 assume intermod products are caused by the
nonlinear mixing of two input tones of equal amplitude. It is essentially the same process as in a mixer for
frequency conversion, where an infinite series is produced that consists of every possible frequency according
to ±j*Tone1 ±k*Tone2. 2nd order products are more likely to fall inband for the direct conversion system
popular these days. A smaller (minimum) IMD2 is better. |
| - Nom - |
| - Max - |
| - Min - |
| 7.14 Δ Output 2nd Order Intermodulation
Products, ΔOIMD2 (dB) |
| Delta IMD2 intermod is the difference between the IMD2 product power (IMD2) and the signal
power, P[sig]. |
| - Nom - |
| - Max - |
| - Min - |
| 7.15 3rd-OrderSpurious-Free Dynamic Range,
SFDR3 (dB) |
| SFDR3 is the theoretical power of two tones at the system input that would generate 3rd order
products at the output with a power just equal to the noise power at the output. |
| - Nom - |
| - Max - |
| - Min - |
| 7.16 Output 3rd Order Intermodulation
Product Power, OIMD3 (dBm) |
| Calculations of IMD3 in RF Cascade Workbook 2004 assume intermod products are caused by the
nonlinear mixing of two input tones of equal amplitude. It is essentially the same process as in a mixer for
frequency conversion, where an infinite series is produced that consists of every possible frequency according
to ±j*Tone1 ±k*Tone2. The 3rd order products that most likely fall inband at the output are ±2*Tone1 ±Tone2
and ±Tone1 ±2*Tone2. In reality, the powers of most products are below the noise power. A smaller (minimum)
IMD3 is better. |
| - Nom - |
| - Max - |
| - Min - |
| 7.17 Δ Output 3rd Order Intermodulation
Products, ΔOIMD3 (dB) |
| Delta IMD3 intermod is the difference between the IMD3 product power (IMD3) and the signal
power, P[sig]. |
| - Nom - |
| - Max - |
| - Min - |
|
| Chapter
1, 2,
3, 4,
5,
6, 7,
8, 9,
10 |
Version 1.01 by Kirt Blattenberger RF Cafe Website
(www.rfcafe.com) |
Chapter 7 |


 One
tip when viewing the cell formulas is to initially place the cursor in the cell, then click the “fx” icon on
the tool bar. This will call up the function input parameter dialog box as shown in Figure 13, and make
modification and evaluation of the function output simpler because the result will be displayed as parameters
are changed.
One
tip when viewing the cell formulas is to initially place the cursor in the cell, then click the “fx” icon on
the tool bar. This will call up the function input parameter dialog box as shown in Figure 13, and make
modification and evaluation of the function output simpler because the result will be displayed as parameters
are changed.