Although the definitions of system cascaded parameters are pretty much standard throughout
the industry, all of the formulas and assumptions used in RF Cascade Workbook are presented here in order to eliminate
any ambiguity. Since formulas are contained in VBA code, you may easily modify them to suit your individual preferences
without having to edit sometimes lengthy formulas directly within the cells.
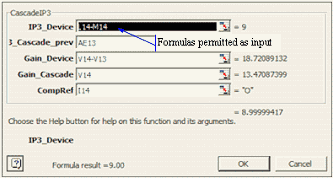
One tip when viewing the cell formulas is to initially place the cursor in the cell, then
click the “fx” icon on the tool bar. This will call up the function dialog box as shown in Figure 8 and make modification
and evaluation of the function output simpler because the result will be displayed as parameters are changed.
|
This section presents all of the formulas used in the VBA functions to calculate system
cascade parameters. In the following equations, the subscript “N” refers to the current stage device parameter,
while “N-1” refers to the cascaded system parameters up through and including the previous stage. Use Figure 7
as a reference when interpreting the formulas. For example, GainN refers to the gain of the current
stage's device. GainN-1 refers to the cascaded gain of all stages preceding the current stage. So referring
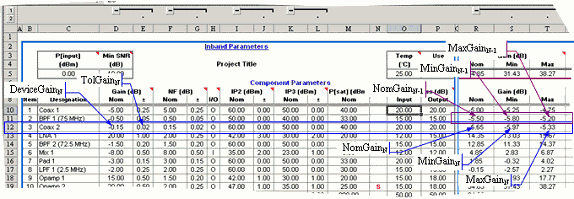
to Figure 7, for N=3, DeviceGainN = -0.15 dB, and NomGainN-1 = -0.5 dB. Finally, upper case
names refer to decibel values (e.g., G = 20 dB or P = 20 dBm), while lower case names refer to linear values (e.g.,
g = 100 or p = 100 mW).
|
|
Min/max formulas are constructed using combinations most likely to occur based on
the available combinations of parameters, rather than just those combinations that yield absolutely the largest
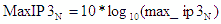
and smallest values. For instance, the maximum IMD3 value uses the cascaded values of MaxP[sig] and MaxIP3 because
both use MaxGain. You may easily modify the Min/Max formula variables to suit
your particular needs.
|
|
|
|
Figure 7 Formula Reference
Designations
|
|
|
|
Figure 8 Function (fx) Dialog
Box
|
|
Convert between decibels and non decibels as follows:
|
|
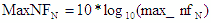
P(dB) = 10*log10
(p)

|
|
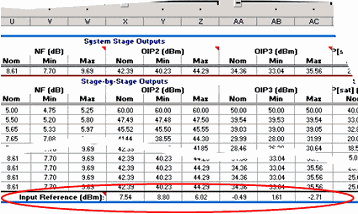
At the bottom of the calculated OIP2 and OIP3 columns, there is a row titled “Input
Reference (dBm)” that contains the equivalent system input referenced values for the Nom, Min
and Max cases.
|
|
|
|
5.1 Gain (dB)
|
|
Gain values expressed in decibels add arithmetically for the linear operating region
(possible output compression is ignored). If the “Use VSWR” cell is set to “Y,” then the interstage VSWR mismatch
values are added to the total gain for Min and Max values. Mismatch loss is not included in the calculation due
to the complexity involved in making a full accounting of the effects – reverse isolation of preceding components,
multiple reflection cycles and other phenomenon would have to be accommodated, and is therefore way beyond the
scope of this workbook.
|
- Nom - |
Nominal cascaded gain uses the sum of the nominal gains for each
of the stages. |
|

|
- Max - |
Maximum cascaded gain uses the sum of the maximum gains of each of
the stages. |
|

|
- Min - |
Minimum cascaded gain uses the sum of the minimum gains for each
of the stages. |
|

|
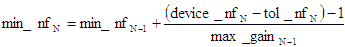
5.2
Noise Figure, NF (dB) |
Noise figure is effectively the reduction of signal to noise ratio
from the cascade input to the output. Noise figure must be calculated using the non decibel (linear) forms of
gain and noise figure, and then converted into decibels. These equations deal with power, so the “10*log10 (v)”
decibel form is used. |
Image Noise |
Image noise, which can and often does contribute to the total noise
power in systems, is not accounted for in RF Cascade Workbook. Image noise is added to the system when frequency
mixing is performed and the image frequency band at the input of the mixer is not sufficiently filtered. The image
frequency is defined as 2*LO-1*RF. Unless the mixer is an image-reject model specifically designed to attenuate
the image frequency, it will translate the image band content (even if it is only noise) into the IF band just
as it will the intended signals. The result is increased noise power that, worst case, could add 3 dB to the noise
floor. If your system can tolerate the hit in sensitivity, then there is no problem. If you must maintain the
highest level of sensitivity, then consider placing a filter before the mixer that will know the image band content
down sufficiently to be negligible at the mixer output. 10 dB of attenuation is a good minimum target for just
thermal noise, but more could be required if there is also signal content in the image band. |
| |
- Nom - |
Nominal cascaded noise figure uses the nominal gains and noise figures
of each of the stages. |
|

|
|
|
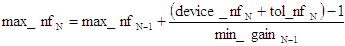
- Max - |
Maximum cascaded noise figure uses the minimum gains and maximum
noise figures of each of the stages. |
|
|
|
|
- Min - |
Minimum cascaded noise figure uses the maximum gains and minimum
noise figures of each of the stages. |
|

|
|
|
5.3
2-Tone, 2nd-Order Intercept Point, OIP2 (dBm) |
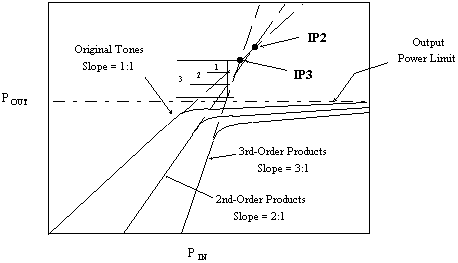
IP2 is the theoretical power at which the 2nd-order intermodulation
products would intersect the power of the original tones (CW) when input/output power slopes are plotted. In the
linear region of operation, the original tones plot on a 1:1 (normalized) slope, while the 2nd-order
products plot on a 2:1 (normalized) slope. Therefore, the product tones increase at twice the rate of the original
tones, and the lines cross at the IP2 point. See Figure 9 for visualization. 2nd-order intermodulation products
are an important consideration in direct conversion and near zero IF systems. |
|
|
|
Figure 9 Intercept Points &
Saturated Power
|
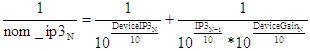
- Nom - |
Nominal cascaded 2nd-order intercept point uses the nominal
gains and IP2s of each of the stages. |
|

|
|
|
|

|
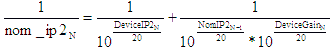
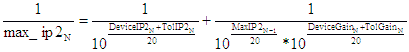
- Max - |
Maximum cascaded 2nd-order intercept point uses the maximum
gains and maximum IP2s of each of the stages. |
|

|
|
|
|

|
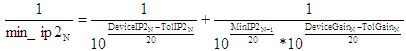
- Min - |
Minimum cascaded 2nd-order intercept point uses the minimum
gains and minimum IP2s of each of the stages. |
|

|
|
|
 |
5.4
2-Tone, 3rd-Order Intercept Point, IP3 (dBm) |
IP3 is the theoretical power at which the 3rd-order intermodulation
products would intersect the power of the original tones (CW) when input/output power slopes are plotted. In the
linear region of operation, the original tones plot on a 1:1 (normalized) slope, while the 3rd-order
products plot on a 3:1 (normalized) slope. Therefore, the product tones increase at three times the rate of the
original tones, and the lines cross at the IP3 point. See Figure 9 for visualization. |
- Nom - |
|
Nominal cascaded 3rd-order intercept point uses the nominal gains and IP3s
of each of the stages.
|
|

|
|
|
|

|
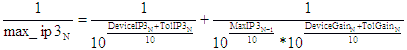
- Max - |
Maximum cascaded 3rd-order intercept point uses the maximum
gains and maximum IP3s of each of the stages. |
|
|
|
|
|

|
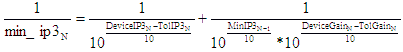
- Min - |
Minimum cascaded 3rd-order intercept point uses the minimum
gains and minimum IP3s of each of the stages. |
|

|
|
|
|

|
5.5
Saturated Power, P[sat] (dBm) |
P[sat] is the output power at which no further increase in the input
power will result in an increase at the output. This, along with the 1 dB compression point (P1dB) is a very nonlinear
region of operation and can only be modeled by sophisticated transfer functions that are unique to each component.
See Figure 9 for visualization. Therefore, no attempt is made to model it here. Instead, the P[sat] value is used
as a monitor for the power level in the system to alert the user to a potential problem. A check is made to determine
whether the power level at the component input, plus the linear gain of the component, results in a power level
equal to or greater than the P[sat] of the component. If so, then the output power is limited to the component's
P[sat] power level. No tolerance input parameter is provided for P[sat] because it normally is not an intentional
design parameter. Note: The cascaded signal power level displayed in the worksheet is calculated as if there is
no saturation limit. |
|
- Nom -
|
|
Nominal gain and P[sat] values are used per the following equation.
|
|

|
|
- Max -
|
Not used. |
- Min - |
|
Not used.
|
5.6
Signal Power, P[sig] (dBm) |
P[sig] is the power of the signal as it propagates through the cascade,
and is increased or decreased by the linear gain of each stage. Note that it is possible for the calculated value
to exceed the P[sat] value, because no adjustment is made. This is done to prevent the annoying case where all
of the other power dependant values are thrown off by an adjusted output power value. There is an indication of
a saturated condition given in the component parameter input area column labeled “!!!.” |
- Nom - |
|

|
|
- Max -
|
|

|
|
- Min -
|
|

|
5.7
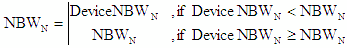
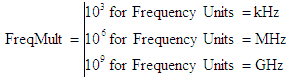
Noise Bandwidth, NBW (Freq Units) |
Cascaded noise bandwidth merely checks the NBW of the current component,
and sets the system NBW to the lesser of either the component NBW or the system's previous NBW. Only a nominal
value is calculated. Frequency units are set on the “Filter-Mixer” worksheet. This value is used with calculations
that include noise power levels, like dynamic range and spurious free dynamic range. |
|
|
|
- Max -
|
Not used. |
- Min - |
|
Not used.
|
5.8
Noise Power, P[n] (dBm) |
P[n] is the power of the noise as it propagates through the cascade,
and is increased or decreased by the gain, noise figure and NBW of each stage. Since the system temperature is
given in Celsius degrees, 273.15 is added to get equivalent Kelvin degrees. NWB is given in whatever Frequency
Units are specified on the “Filter-Mixer” worksheet, so a multiplication by the appropriate factor is done. Note
that MaxGain is used with MaxNF and MinGain is used with MinNF. This is because in most systems the noise figure
is set near the cascade input where the least amount of gain has accumulated. Your specific application might
warrant a different combination of Min/Max values. See section 5.2 for discussion on image noise contribution
to noise power. In the following equations, k is Boltzmann's constant. |
- Nom - |
|

|
|
- Max -
|
|

|
|
- Min -
|
|

|
|
, where:
|
5.9
Signal to Noise Ratio, SNR (dB) |
SNR is the difference between the noise power level and the signal
power level. |
- Nom - |
|

|
|
- Max -
|
|

|
|
- Min -
|
|

|
5.10
Saturated Dynamic Range, SDR (dB) |
SDR is the difference between the saturated power level and the noise
power level, minus the minimum system SNR, as specified in the system parameter area (Min SNR). This is different
than the traditional dynamic range (DR), which references the 1 dB compression point (P1dB); RF Cascade Workbook
2004 does not calculate P1dB. Since P[sat] is typically about 2 or 3 dB above P1dB, the traditional dynamic range
will be about 2 or 3 dB lower. |
- Nom - |
|

|
|
- Max -
|
|

|
|
- Min -
|
|

|
5.11
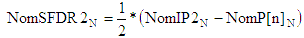
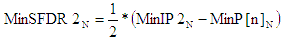
2nd-Order Spurious-Free Dynamic Range, SFDR2 (dB) |
SFDR2 is the difference between the IP2 power and the theoretical
power of two tones at the system input that would generate 2nd order products at the output with a
power just equal to the noise power at the output. |
- Nom - |
|
|
|
- Max -
|
|
|
|
- Min -
|
|
|
5.12
2nd Order Intermodulation Product Power, IMD2 (dBm) |
Calculations of IMD2 in RF Cascade Workbook 2004 assume intermod
products are caused by the nonlinear mixing of two input tones of equal amplitude. It is essentially
the same process as in a mixer for frequency conversion, where an infinite series is produced that consists of
every possible frequency according to ±j*Tone1
±k*Tone2. 2nd order products are more likely to fall inband for the direct
conversion system popular these days. A smaller (minimum) IMD2 is better. |
span="3">- Nom -
|

|
|
- Max -
|
|

|
|
- Min -
|
|

|
5.13
Delta 2nd Order Intermodulation Products, ΔIMD2 (dB) |
Delta IMD2 intermod is the difference between the IMD2 product power
(IMD2) and the signal power, P[sig]. |
- Nom - |
|

|
|
- Max -
|
|

|
|
- Min -
|
|

|
5.14
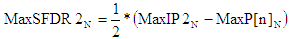
3rd-Order Spurious-Free Dynamic Range, SFDR3 (dB) |
SFDR3 is the difference between the IP3 power and the theoretical
power of two tones at the system input that would generate 3rd order products at the output with a power just
equal to the noise power at the output. |
- Nom - |
|
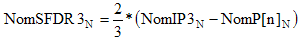
|
|
- Max -
|
|
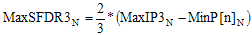
|
|
- Min -
|
|
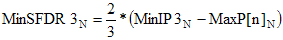
|
5.15
3rd Order Intermodulation Product Power, IMD3 (dBm) |
Calculations of IMD3 in RF Cascade Workbook 2004 assume intermod
products are caused by the nonlinear mixing of two input tones of equal amplitude. It is essentially
the same process as in a mixer for frequency conversion, where an infinite series is produced that consists of
every possible frequency according to ±j*Tone1
±k*Tone2. The 3rd order products that most likely fall inband
at the output are ±2*Tone1
±Tone2 and ±Tone1
±2*Tone2. In reality, the powers of most products are below
the noise power. A smaller (minimum) IMD3 is better. |
- Nom - |
|

|
|
- Max -
|
|

|
|
- Min -
|
|

|
5.16 Delta 3rd Order Intermodulation
Products, ΔIMD3 (dB) |
Delta IMD3 intermod is the difference between the IMD3 product power
(IMD3) and the signal power, P[sig]. |
- Nom - |
|

|
|
- Max -
|
|

|
|
- Min -
|
|

|
5.17
Interstage VSWR Mismatch Error (dB) |
VSWR mismatch errors are caused by constructive and destructive interference
of the voltage standing waves at component interfaces due to impedance mismatches. This is not the sum of all
VSWR errors (see VSWR Mismatch columns to the right cumulative). It is assumed that there is infinite isolation
between the component's input and output ports. These equations deal with voltage, so the “20*log10 (v)” decibel
form is used. Only amplitude errors (not phase) are used. |
- Neg - |
|
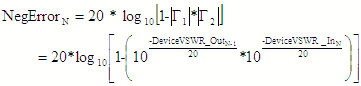
|
|
- Pos -
|
|
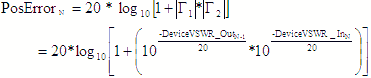
|
5.17
Cumulative VSWR Mismatch Error (dB) |
This is the sum of the Pos and Neg Interstage VSWR Mismatch Errors
for all stages. If a “y” or “Y” is entered in the “Use VSWR” cell in the input parameters area, then these values
are included in the Min/Max Gain calculations, and consequently ripple through all the calculations that depend
on the min/max gain values. If “n” or “N” is entered, then all of the values are reported as zeros. |
|
Chapter
1, 2,
3, 4,
5, 6,
7, 8,
9,
10, 11,
12,
13
|
Version 1.11 by Kirt Blattenberger RF Cafe Website (www.rfcafe.com)
|
Chapter 5
|