Module 18 - Radar PrinciplesPages
i,
1-1, 1-11,
1-21,
1-31,
1-41,
2-1,
2-11,
2-21,
2-31,
2-41,
3-1,
3-11,
3-21,
4-1,
4-11,
4-21,
AI-1,
AII-1,
Index-1 to 3
Chapter 4
Radar System Maintenance Learning
Objectives
Upon completion of this chapter, the student will be able to: 1. Interpret the transmitter
frequency spectrum in terms of frequency distribution, power output, receiver response, and an acceptable spectrum
curve.
2. Describe the methods for measuring the average and peak power outputs of a radar transmitter. 3. Describe the methods of measuring receiver sensitivity. 4. Define receiver bandwidth in terms of the
receiver response curve and state the most common methods of measuring TR tube recovery time. 5. List the
support systems associated with a typical shipboard radar system and describe the basic function of each. 6. State the general rules for the prevention of personnel exposure to RF radiation and X-ray emissions. Introduction to Radar Maintenance The effectiveness of your radar system depends largely upon the care and attention you give it. An improperly
adjusted transmitter, for example, can reduce the accuracy of a perfectly aligned receiver; the entire system then
becomes essentially useless. Maintenance, therefore, must encompass the entire system for best operation. Because of the complexity of most radar systems, trying to detail step-by-step procedures for specific maintenance
actions in this chapter is impractical. However, the basic procedures for some maintenance actions that are common
to most radar systems will be discussed. Also, an overview of support systems for radars will be presented. This
will include electrical power, dry-air systems, and liquid cooling systems. Finally, safety precautions inherent
to radars are listed. Transmitter Performance CHECKS The transmitter of a radar is designed to operate within a limited band of frequencies at an optimum power
level. Operation at frequencies or power levels outside the assigned band greatly decreases the efficiency of the
transmitter and may cause interference with other radars. Therefore, transmitter performance must be monitored
closely for both frequency and output power. 4-1
Transmitter Frequency Whether of the fixed-frequency or tunable type, the radar
transmitter frequency should be checked periodically. If the transmitter is of the fixed-frequency type and found
to be operating outside its normal operating band, the problem is probably a defective part. The defective
component must be replaced. If the transmitter is tunable, the transmitter must again be tuned to the assigned
frequency. Each time a radar transmitter generates an RF pulse, it produces electromagnetic energy. You should
recall from your study of NEETS, Module 12, Modulation Principles, that the square wave used to modulate the
transmitter carrier wave has (1) the fundamental square-wave frequency and (2) an infinite number of odd harmonics
of the fundamental square wave frequency. When this square wave is used to modulate the transmitter carrier
frequency, both the fundamental and odd harmonic frequencies of the square wave heterodyne with the transmitter
carrier frequency. The heterodyning process produces in each transmitted RF pulse the following frequencies: 1. The fundamental carrier frequency 2. The sum and difference frequencies between the carrier and
fundamental square-wave frequencies 3. The sum and difference frequencies between the odd harmonics of the
square wave and the carrier frequencies For a complete discussion of this process, you should review
module 12. Actually, the radar energy is distributed more or less symmetrically over a band of
frequencies. This frequency distribution of energy is known as the Frequency SPECTRUM. An analysis of frequency
spectrum characteristics may be made with a SPECTRUM ANALYZER. The spectrum analyzer presents a graphic display of
energy versus frequency. An extensive explanation of spectrum analyzer use can be found in the Electronics
Installation and Maintenance Book (EIMB), Test Methods and Practices, NAVSEA 0967-LP-000-0130.
Spectrum Analysis When properly performed and interpreted, a spectrum analysis will reveal
misadjustments and troubles that would otherwise be difficult to locate. Therefore, you should be able to perform
a spectrum analysis and understand the results. You may be wondering why we are so interested in the
frequency spectrum of an RF pulse. To better understand why, look at the spectrum of a transmitter as compared to
the response curve of a receiver in figure 4-1. The receiver's response curve has a broader bandwidth than the
transmitted spectrum, which ensures complete coverage. But the receiver responds best to frequencies in the middle
of the bandwidth. This causes the receiver response to taper off from both sides of the center frequency until the
response passes through the half-power points, as shown on the curve. Usually the receiver response beyond these
points is too low to be useful and is not considered. Notice that the spectrum of the transmitter is centered
inside the response curve of the receiver, thus yielding maximum efficiency. 4-2
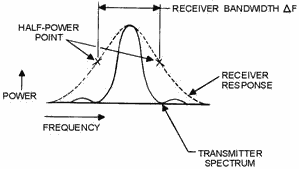
Figure 4-1. - Transmitter spectrum compared with receiver response. Any frequency, when modulated by another frequency, will produce a base frequency with sideband
frequencies (sum and difference). In other words, the output of a pulsed radar will contain more than one
frequency. The output frequency spectrum of the pulsed radar transmitter does not consist of just a single
frequency that is turned on and off at the pulse-repetition frequency (PRF). Consider the spectrum as a base
frequency (carrier) that is modulated by short rectangular pulses occurring at the PRF of the radar. Two distinct
modulating components are present: One component consists of the PRF and its associated harmonics; the other
component consists of the fundamental and odd-harmonic frequencies that make up the rectangular modulating pulse. The distribution of power over the radar frequency spectrum depends on the amount of modulation. a pulsed
radar spectrum is illustrated in figure 4-2. The vertical lines represent the modulation frequencies produced by
the PRF and its associated harmonics; the lobes represent the modulation frequencies produced by the fundamental
pulse frequency and its associated harmonics. The amplitude of the main lobe falls to zero on each side of the
carrier. The side lobes are produced by the odd harmonics of the fundamental pulse frequency. The zero points are
produced by the even harmonics of the fundamental pulse frequency. In an ideal spectrum each frequency above the
carrier has its counterpart in another frequency below the carrier. These frequencies are equally spaced and have
equal power. Therefore, the pattern is symmetrical about the carrier. The main lobe, of course, contains the major
portion of the transmitted RF energy.
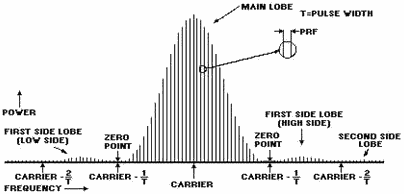
Figure 4-2. - Spectrum of a pulse-modulated carrier. 4-3
A radar transmitter in good condition should produce a spectrum curve similar to the curves shown in
view a or B in figure 4-3. Good curves are those in which the two halves are symmetrical and contain deep,
well-defined minimum points (minima) on both sides of the main peak. 
Figure 4-3. - Comparison of radar spectra. A curve without well-defined minima, as in the curve shown in view C, indicates that the transmitter
output is being frequency modulated during the pulse. This condition may occur when a pulse without sufficiently
steep sides or a flat peak is applied to the transmitter. It may also occur when a transmitter tube is unstable or
is operated without proper voltage, current, or magnetic field. An extremely irregular spectrum, as in the
curve in view D, is an indication of severe frequency modulation. This condition usually causes trouble with the
receiver automatic frequency control (AFC) as well as a general loss of signal strength. You can often improve a
faulty spectrum by adjusting the transmission line stubs or by replacing the transmitter tube. When the spectrum
has two large peaks that are quite far apart, it indicates that the transmitter tube is DOUBLE MODING (shifting
from one frequency to another). This could be caused by standing waves in the transmission line or a faulty
transmitter tube. Standing waves may be caused by a faulty line connection, a bad antenna rotating joint, or
obstructions in the line. (Standing waves are described in NEETS, Module 10, Introduction to Wave Propagation,
Transmission Lines, and Antennas.) 4-4
In the case of a good or fair spectrum curve with sharply defined minimum points on both sides of the
main lobe, the distance between these two points is proportional to the duration of the transmitted pulse. The device most commonly used to check the frequency spectrum of a radar transmitter is the spectrum analyzer.
Frequency-Measuring Devices Devices used to determine the basic carrier frequency of
a radar transmitter are the ELECTRONIC Frequency COUNTER, the WAVEMETER, and the ECHO BOX. One or more of these
devices may be included in a special Radar Test SET designed for a specific system or type of radar. Radar test
sets quite often consist of several types of test equipment. This combination of test equipments enables both
transmitter and receiver performance checks to be carried out with one test instrument. Electronic frequency
counters, frequency meters, and wavemeters are discussed in NEETS, Module 16, Introduction to Test Equipment. The
echo box is discussed in the next section. The specific equipments and procedures required to measure the
frequency of any radar system are found in the associated system technical manuals and related PMS documents.
Q1. The spectrum of a radar transmitter describes what characteristic of the output pulse? Q2.
Where should the transmitter spectrum be located with respect to the receiver response curve? Q3. The
ideal radar spectrum has what relationship to the carrier frequency? Q4. The display screen of a
spectrum analyzer presents a graphic plot of what two signal characteristics? The Echo Box
The ECHO BOX is an important test instrument for indicating the overall radar system performance. The echo-box
test results reflect the combined relative effectiveness of the transmitter as a transmitter of energy and the
receiver as a receiver of energy. The echo box, or RESONANCE CHAMBER, basically consists of a resonant
cavity, as shown in view a of figure 4-4. You adjust the resonant frequency of the cavity by varying the size of
the cavity (the larger the cavity the lower the frequency). a calibrated tuning mechanism controls the position of
a plunger and, therefore, the size of the cavity. The tuning mechanism is adjusted for maximum meter deflection,
which indicates that the echo box is tuned to the precise transmitted frequency. The tuning mechanism also
indicates on a dial (figure 4-5, view A) both the coarse transmitted frequency and a numerical reading. This
reading permits the technician to determine the transmitted frequency with greater accuracy by referring to a
calibration curve on a chart (figure 4-5, view B). 4-5

Figure 4-4. - Echo box. 
Figure 4-5. - Reading the echo box dial. 4-6
Energy is coupled into the cavity from the radar by means of an RF cable connected to the input loop.
Energy is coupled out of the cavity to the rectifier and meter by means of the output loop. You can vary the
amount of coupling between the echo box and the crystal rectifier by changing the position of the output loop. a
schematic diagram of the output circuit is shown in figure 4-4, view B. The energy picked up by the loop is
rectified, filtered, and applied to the meter. The method of connecting the echo box in a radar system is shown in
figure 4-4, view C.
RING TIME MEASUREMENTS Some of the energy generated by the radar transmitter is
picked up by the echo box by means of the directional coupler. This energy causes oscillations (known as RINGING)
within the echo box that persist for some time after the end of the radar pulse, much in the fashion of an echo
that persists in a large room after a loud noise. As this echo dies down, a part of it is fed back into the radar
receiving system, again by means of the directional coupler. The ringing causes a saturating signal to appear on
the radar indicator (figure 4-6). The longer this ringing extends, the better the performance of the radar.

Figure 4-6. - Ring time saturation of A-scope and PPI. The length of time the echo box should ring under the particular conditions of the test is called the
EXPECTED RING TIME. You may determine whether or not the radar is performing well by comparing the expected ring
time with the ring time observed. The ring time to be expected on a good radar depends on the particular
type of radar being tested; on the way the echo box is installed - that is, whether a directional coupler or a
pickup dipole is used; on the length and type of cable used; on the individual ringing ability of the particular
echo box in use; on the frequency of the radar; and on the temperature of the echo box at the time of the test.
Corrections are made for all of these factors according to the procedure given in the technical manual for the
echo box being used. You may use an echo box without correction to detect a change in the performance of a radar. You simply log
and compare the ring time from day to day. You should recognize that these readings do not 4-7
permit the comparison of a particular radar with a standard of performance; however, you can use the
readings to tell whether or not its performance is deteriorating. Because ring time measurements are the
most valuable single feature of the echo box, they must be measured properly. Ring time measurements are made on
the A-scope or on the ppi. In measuring the ring time, you should make sure the echo-box ringing (not some
fixed-target echo or block of echoes) is being monitored. You can determine this condition by adjusting the radar
gain control and noting if the ring time varies on the scope. The echo box ringing will change in duration; fixed
target echoes, however, will not change duration. To obtain the best results, you should repeat every ring
time measurement at least four times; then average the readings. You should take special care to ensure that all
readings are accurate. If two or more technicians use the same echo box, they should practice together until their
ring time measurements agree.
Transmitter Power MEASUREMENT Because high peak power and radio frequencies are
produced by radar transmitters, special procedures are used to measure output power. High peak power is needed in
some radar transmitters to produce strong echos at long ranges. Low average power is also desirable because it
enables transmitter components to be compact, more reliable, and to remain cooler during operation. Because of
these considerations, the lowest possible duty cycle (PW x PRF) must be used for best operation. The relationships
of peak power, average power, and duty cycle were described in chapter 1. Peak power in a radar is primarily a
design consideration. It depends on the interrelationships between average power, pulse width, and
pulse-repetition time. You take power measurements from a radar transmitter by sampling the output power.
In one sampling method, you use a pickup horn in front of the antenna. Air losses and weather conditions make the
horn placement extremely critical and also affect the accuracy of the sample. a more accurate and convenient
method can be used. In this method, you sample the output power through a directional sampling coupler located at
the point in the transmitter where a power reading is desired. Power-amplifier transmitters usually have sampling
couplers after each stage of amplification. Some radar sets have built-in power-measuring equipment;
others require the use of general purpose test equipment or a special test set. In any case, the measuring
instruments are most often referenced to 1 milliwatt; readings are taken in dBm (a discussion of the decibel
measurement system was presented in NEETS, Module 11, Microwave Principles). When taking power
measurements, you must allow for power losses. You must add the directional coupler attenuation factor and the
loss in the connecting cable to the power meter reading. The sum is the total power reading. For example, the
directional coupler has an attenuation factor of 20 dB, the connecting cable has a loss rating of 8 dB, and the
reading obtained on the power meter is 21 dBm. Therefore, the transmitter has an output power that is 49 dBm (21 +
20 + 8). Power readings in dBm obtained by the above procedure are normally converted to watts to provide useful
information. Although the conversion can be accomplished mathematically, the procedure is relatively complex and
is seldom necessary. Most radar systems have a conversion chart, such as the one shown in figure 4-7, attached to
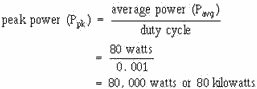
the transmitter or the test equipment. As you can see on the chart, 49 dBm is easily converted to 80 watts average
power. 4-8

Figure 4-7. - Conversion of power in dBm to watts (average). You can convert average power to peak power by dividing average power by the duty cycle of the radar. If
the radar in the above example has a duty cycle of 0.001, then the peak power can be calculated with the following
formula:
Many radar systems have charts available to convert average power to peak power. Q5. The peak power
of a radar depends on the interrelationship of what other factors? Q6. Transmitter power readings are
most often referenced to what power level? RECEIVER Performance CHECKS The
performance of a radar receiver is determined by several factors, most of which are established in the design
engineering of the equipment. In the paragraphs that follow, factors concerned with 4-9
maintenance are considered. Important factors are (1) receiver sensitivity, which includes noise
figure determination and minimum discernible signal (MDS) measurement; (2) TR recovery time; and (3) receiver
bandwidth.
Many radar systems contain circuits that serve special functions. Three of these special circuits are
instantaneous automatic gain control (IAGC), sensitivity time control (STC), and fast time constant (ftc). These
circuits may be found in combination or alone, depending on the purpose of the radar. When the test methods and
procedures about to be described are used, these special functions should not be used. If an automatic frequency
control (AFC) circuit is included in the radar, it may be permitted to operate during receiver tests. a good way
you can check AFC circuit operation is to complete the tests specified for manual tuning and then switch to AFC.
If the AFC circuit operation is normal, test indications should not differ. RECEIVER SENSITIVITY
Insufficient detection range in a radar system can be caused by decreased sensitivity in the radar receiver. This
condition results mainly from the great number of adjustments and components associated with the receiver. a
decrease of receiver sensitivity has the same effect on range performance as does a decrease of transmitter power.
For example, a 6 dB loss of receiver sensitivity shortens the effective range of a radar just as much as a 6 dB
loss in transmitter power. Such a drop in transmitter power is evident and is easy to detect. On the other
hand, a 6 dB loss in receiver sensitivity, which can easily result from a slight misadjustment in the receiver, is
difficult to detect unless accurate measurements are made. Figure 4-8 shows a comparison of radar system
performance versus maximum range. The system performance loss in dB includes both transmitter and receiver losses.
You should note that with a loss of 5 dB in both receiver and transmitter (a total of 10 dB), only 55 percent of
the maximum range of the system is realized. 4-10
| - |
Matter, Energy,
and Direct Current |
| - |
Alternating Current and Transformers |
| - |
Circuit Protection, Control, and Measurement |
| - |
Electrical Conductors, Wiring Techniques,
and Schematic Reading |
| - |
Generators and Motors |
| - |
Electronic Emission, Tubes, and Power Supplies |
| - |
Solid-State Devices and Power Supplies |
| - |
Amplifiers |
| - |
Wave-Generation and Wave-Shaping Circuits |
| - |
Wave Propagation, Transmission Lines, and
Antennas |
| - |
Microwave Principles |
| - |
Modulation Principles |
| - |
Introduction to Number Systems and Logic Circuits |
| - |
- Introduction to Microelectronics |
| - |
Principles of Synchros, Servos, and Gyros |
| - |
Introduction to Test Equipment |
| - |
Radio-Frequency Communications Principles |
| - |
Radar Principles |
| - |
The Technician's Handbook, Master Glossary |
| - |
Test Methods and Practices |
| - |
Introduction to Digital Computers |
| - |
Magnetic Recording |
| - |
Introduction to Fiber Optics |
| Note: Navy Electricity and Electronics Training
Series (NEETS) content is U.S. Navy property in the public domain. |
|