|
January 1969 Electronics World
 Table of Contents
Wax nostalgic about and learn from the history of early electronics. See articles
from
Electronics World, published May 1959
- December 1971. All copyrights hereby acknowledged.
|
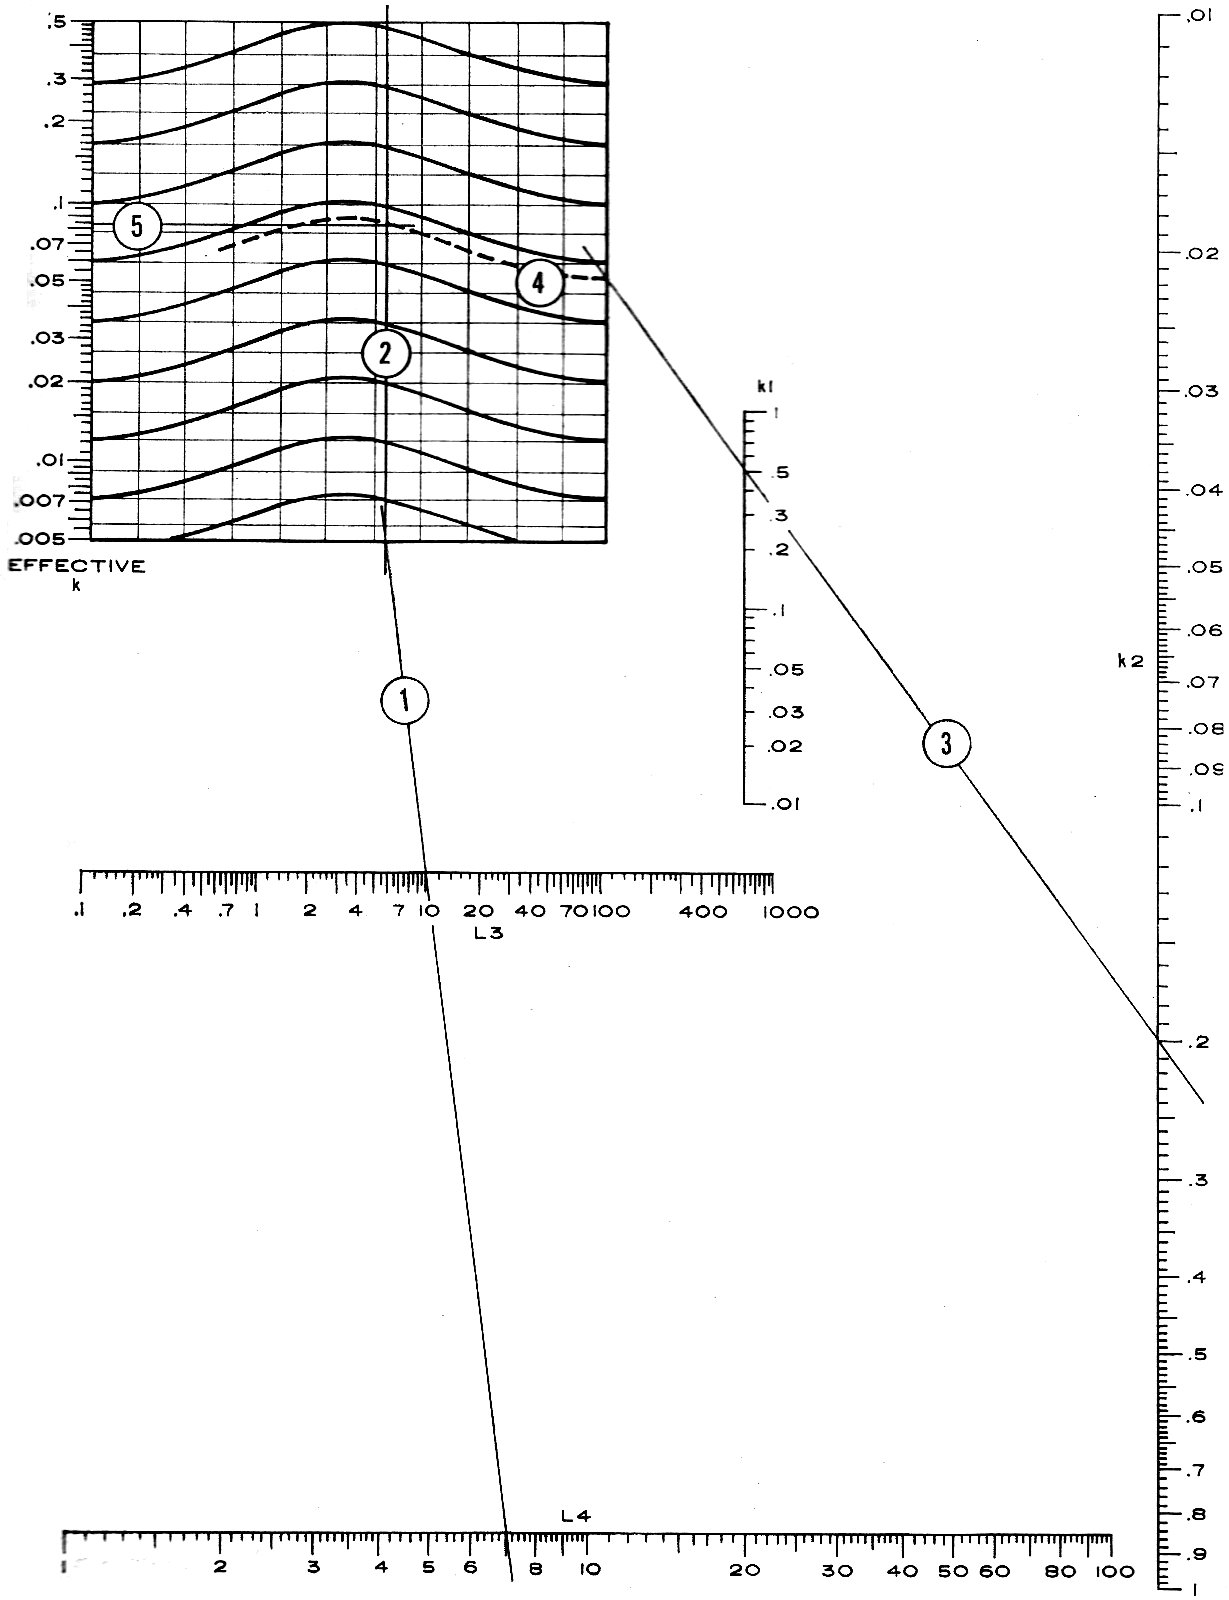
This nomogram (aka nomograph)
provides a "simple" method for determining the coupling coefficient (ke)
of air core transformers for RF circuits where the operational wavelength is much
longer than the physical length of the transformer. Modern circuit simulators can
calculate such quantities at the blink of an eye, but in 1969 there was no simple
method for doing it. In fact, a lot of design work back in the day was done using
nomograms because given all the impreciseness of circuit layout and component tolerances,
there were enough tunable elements provided to tweak for optimal performance. Unlike
today where the use of sophisticated (and expensive) software can practically assure
first-pass success with circuits into the realm of tens of GHz, multiple iterations
of designs used to be the norm. As an electronics technician before earning my BSEE,
I built and modified many circuits for the engineers I worked for before they went
into production. We've come a long way, baby.
Link Coupling Nomogram
By Donald W. Moffat
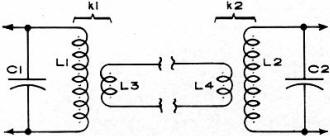
Fig. 1. In radio-frequency circuits, air-core transformers
are often used to match the source impedance to the load.
Calculating coupling coefficient values, ke, can be a tedious and
messy mathematical process. But if the link coupling's physical length is less than
the wavelength, this nomogram can do the job.
When a signal source is physically separated from the circuit it supplies, link
coupling like that shown in Fig. 1 is often used to match impedances. A second
transformer matches the link to the load. Although air-core radio frequency transformers
are shown in the diagram, this method of coupling is equally applicable at low audio
frequencies.
Link coupling would probably be used more often except that the mathematics discourages
a designer from attempting to predict the over-all coupling coefficient, ke.
However, if one assumes that the length of the link is significantly less than a
wavelength of the frequency being coupled, then the equations become manageable.
A nomogram can then be made and ke found without any calculations. As
the length of the link approaches the wavelength, the nomogram becomes less dependable.
And when the link is longer than a wavelength, this nomogram does not apply at all.
Using the Nomogram
 It will be helpful to first examine the
curves in the upper left of the nomogram. The scale on the left and the background
grid of light horizontal and vertical lines serve as guides when determining values
of Effective k. Although only nine curves are drawn, the user should visualize
an unlimited number of curves, all of the same shape, filling in the spaces. It will be helpful to first examine the
curves in the upper left of the nomogram. The scale on the left and the background
grid of light horizontal and vertical lines serve as guides when determining values
of Effective k. Although only nine curves are drawn, the user should visualize
an unlimited number of curves, all of the same shape, filling in the spaces.
When the instructions say to follow a curve from the vertical axis, it will often
be necessary to picture a curve which starts from a given place on the axis, and
follows the same shape as the others. This is shown in example.
To find ke on the nomogram, we must know the inductances of the windings
at either end of the link and the coefficients of coupling of the two transformers.
The order of the five steps in the following paragraphs should be adhered to when
determining ke values.
(a) Locate the correct inductance values on the L3 and L4 scales and draw a straight
line through these points, extending the line to cross the heavy horizontal line
at the bottom of the curves.
(b) From that point on the heavy horizontal line, draw a vertical line straight
up through the curves, using the nearest vertical grid line as a guide.
(c) Locate the correct values of individual coefficients of coupling on the k1
and k2 scales and draw a straight line through them. Extend this line and cross
the heavy vertical line that bounds the curves on the right.
(d) Follow the curve which also intersects at this point on the heavy vertical
line, until it intersects with the vertical line drawn in Step (b). It may happen
that one of the curves in the drawing starts at that intersection, or it may be
necessary to visualize a curve which has the same shape as the others.
(e) From the point where the curve intersects with the line drawn in Step (b),
proceed straight out to the ke scale on the left. Use the nearest horizontal
grid line as a guide and at the ke scale read the effective coefficient
of coupling from input to output.
It is interesting to note that ke increases if either of the individual
coefficients of coupling is increased and, for a given combination of k1 and k2,
the maximum ke occurs when L3 is equal to L4. The value of maximum ke
(when the inductances are equal) is equal to one-half the product of the individual
coefficients of coupling, so a theoretical maximum of ke = 1/2 is approached
when k1 and k2 both approach unity and both inductances have the same value.
Example
Find ke if the circuit diagram has L3 and L4 values of 10 and 7 microhenrys,
respectively, and k1 and k2 values of 0.5 and 0.2. Total length of the link is significantly
less than a wavelength of the frequency being coupled.
1. Draw a line from 7 on the L4 scale, through 10 on the L3 scale, to the heavy
horizontal line that bounds the curves in the upper left corner.
2. Draw a line straight up from that point, parallel to the nearest vertical
grid line.
3. Draw a line from 0.2 on the k2 scale, through 0.5 on the k1 scale, to the
heavy vertical line that bounds the curves on their right.
4. The dotted curve shows how a curve should be visualized if a printed one does
not meet the line drawn in Step 3. Follow the curve to where it intersects with
the line drawn in Step 2.
5. From that intersection, use the nearest horizontal grid line as a guide and
proceed straight out to the Effective k scale. Read the answer of ke
= 0.084.
Since no units are shown on the L scales, the user of the nomogram can supply
any set of units that applies to his circuit, as long as he uses the same units
on both scales. For instance, both scales can be called microhenrys, millihenrys,
or even tenths of a microhenry if such values would be most useful in a particular
application.
Posted June 12, 2017
Nomographs / Nomograms Available on RF Cafe:
-
Parallel Series Resistance Calculator -
Transformer Turns Ratio Nomogram -
Symmetrical T and H Attenuator Nomograph -
Amplifier Gain Nomograph -
Decibel
Nomograph -
Voltage and Power Level Nomograph -
Nomograph Construction -
Nomogram Construction for Charts with Complicating Factors or Constants
-
Link Coupling Nomogram -
Multi-Layer Coil Nomograph
-
Delay Line Nomogram -
Voltage, Current, Resistance, and Power Nomograph -
Resistor Selection Nomogram -
Resistance and Capacitance Nomograph -
Capacitance Nomograph -
Earth
Curvature Nomograph -
Coil Winding Nomogram -
RC Time-Constant Nomogram -
Coil Design
Nomograph -
Voltage, Power, and Decibel Nomograph -
Coil Inductance Nomograph -
Antenna Gain Nomograph
-
Resistance and Reactance Nomograph -
Frequency / Reactance Nomograph
|