March 1930 Radio News
 [Table
of Contents] [Table
of Contents]
Wax nostalgic about and learn from the history of early
electronics. See articles from
Radio & Television News, published 1919-1959. All copyrights hereby
acknowledged.
|
Here is what an app looked like
in 1930. Even in today's world with computing devices everywhere sporting simulators
and component calculating programs, there are still times when having a good old
fashioned nomograph or chart handy can be very useful while in sitting at a bench
selecting component values for tweaking or troubleshooting a design. The advantage
of such visual aids is that they provide a big picture of what's happening as frequencies,
lengths, widths, core materials, etc. change - being able to see both the trees
and the forest, so to speak. When you are working in bands where the component physical
size is a significant portion of the wavelength, things get more complicated and
a combination of trial and error and calculations / simulations are needed. At the
IC design level, of course, you have no choice but to rely solely on your computer,
but if you regularly conduct part of your circuit design at a lab bench, I recommend
gathering a collection of these kinds of charts and graphs either on your laptop,
table, smartphone, or even in a paper folder. They can take a lot of the mystery
out of what is happening as you work.
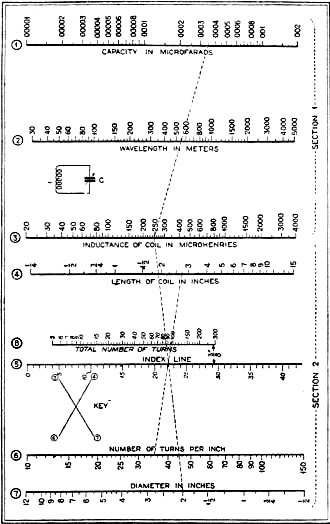
This Chart and a Ruler Will Give You All You Need to Know About
Coil Design
 By W. Bruce Ross By W. Bruce Ross
The September, 1929, issue of Radio News contained a calculation chart, showing
how a coil of suitable inductance could be wound to cover a definite band of wavelengths
when shunted by a variable condenser of known value. Or if the reader has a coil
and condenser, it is possible, with this scale, to determine the tuning range of
the two, when connected in a tuning circuit.
We have worked out a further application of the above-mentioned chart which makes
unnecessary the use of paper and pencil calculations in estimating coil sizes and
wavelength ranges. This involves the addition of another line (Number 8), which
appears in the accompanying illustration, and which is exactly three-eighths of
an inch from the original Index Line, No.5.
The graduations on this line represent the total number of turns on the coil.
We shall call this line No.8. We already have scales marked "Number of turns per
inch" (No. 6), and "Length of coil in inches" (No. 4), so that the new scale must
fit in with these. Indeed, it is by means of No. 4 and No. 6 that we graduate No.8.
Imagine a coil 1 inch long, wound with wire of such a diameter that there are
exactly 10 turns to the inch. There will naturally be 10 turns in the coil. If we
lay our straight-edge between 1 on scale No. 4 and 10 on scale No. 6, then the point
where we cross the new scale must be the "10" point. Make a short mark on line No.
8, and put 10 beside it lightly. Suppose now that the coil is still 1 inch long
but that we wind it with wire having 15 turns to the inch. There will be 15 turns
on the coil. Shifting the straight-edge so as to join 15 on No. 6 and 1 on No. 4,
we make a mark where it crosses the new line and put a "15" beside it. Similarly
an imaginary coil having 20 turns to the inch, and 1 inch long. gives us the 20-turn
point on No. 8. and so on up to 50.
We can go back, and by joining 11, 12, 13, -, 19 on No. 6 with 1 on No. 4, find
the points for 11, 12, 13, -, 19 on No. 8; then using points 22, 24, 26. -, 38 on
No. 6. find corresponding points on No. 8. (You will easily see that the graduation
marks on No. 8 will be closer than those on No. 6, so that, to avoid confusion on
the former, we drop the points for 21, 23, -, 39, and all the forties but 45).
We might go on up to 150 on No. 8 by simply joining the points 60, 70, etc. on
No. 6 with 1 on No. 4; but it will be found that for these higher numbers the straight-edge
makes such an acute angle with the new line that it becomes increasingly difficult
to judge precisely where they cross, and errors in graduation are likely to result.
Fortunately, there is a simple dodge which will obviate this. Prolong our imaginary
coil to 2 inches in length. If we wind it with wire having 30 turns per inch, we
will have wound 60 turns in all. Placing the straight-edge so that it join 30 on
No. 6 with 2 on No. 4, we see that it must cross No. 8 at the point "60" We therefore
mark it as such. Again, if we wind the 2-inch long coil with 35-turns-per-inch wire,
it will have a total of 70 turns. Joining 35 on No. 6 with 2 on No. 4, we locate
"70" on No. 8. And similarly, joining points "40," "45." and "50" on No. 6 with
"2" on No. 4 gives us points "80," "90," and "100" on No. 8. It will be found advisable
to put in more than the 55. 65, 75, etc., points on the new scale, because otherwise
the graduations would be too close for easy reading.
As a check, you will notice that the downward-sloping illustration line, indicating
a coil 2 3/4 inches long wound with 35-turns-per-inch wire, cuts scale No. 8 at
96. The exact number of turns is 96.25, thus showing the scale to be quite accurate
enough for any case in which the chart would be used.
There will be few calls, in all probability, for points corresponding to numbers
greater than 100 on scale No. 8, but for completeness' sake and for possible future
needs, the 110, 120, 130, - 200 points may be located by using point 2 on No. 4
and appropriate points on No. 6. For the 5, 6, 7, 8 and 9 positions on No. 8 we
may joint 1/2 on No. 4 with 10, 12, 14, 16 and 18 on No. 6. It is little use going
below 5 on No. 8, as the chart is not accurate for such short coils.
Caution - Do not rely on the point marked 1/4 on scale No. 4. It is out of place,
its proper position being about 1/8 inch higher up on the line.
If you decide to ink your work in - and this is a very good plan - draw two faint
lines to the right of No. 8 and parallel to it, at distances of 1/16 and 3/32 inches
respectively. Prolong the marks representing the numbers 5, 6, 7, 8. 9, 10, 15,
20, 30, 40, 50, 60, 70, 80, 90, 100, 150 and 200 to the 3/32 inch line, and the
smaller divisions to the 1/16 inch line. Put numbers opposite the long lines only.
While you are doing this, it will be a good plan to make a further slight addition
which will facilitate the use of the chart. Divide the Index Line (No.5) into equal
sections (points 1/8 of an inch apart will do nicely) and number them consecutively
- whether up or down is quite immaterial. If you do this, you will save marking
up the chart with pencil every time you use it.
To illustrate by the broken lines printed on the chart: instead of actually drawing
the line from 250 on scale No.3 to 2 on No. 7, simply read the intersection of the
straight-edge with the Index Line. Suppose it is 21.9. Then swing the straight-edge
to 35 on No. 6, check that it passes through 21.9 on the Index Line, and read off
96 turns on No. 8, and 2 3/4 inches on No. 4.
Posted February 11, 2022
(updated from original post on 2/13/2014)
Nomographs / Nomograms Available on RF Cafe:
-
Parallel Series Resistance Calculator -
Transformer Turns Ratio Nomogram -
Symmetrical T and H Attenuator Nomograph -
Amplifier Gain Nomograph -
Decibel
Nomograph -
Voltage and Power Level Nomograph -
Nomograph Construction -
Nomogram Construction for Charts with Complicating Factors or Constants
-
Link Coupling Nomogram -
Multi-Layer Coil Nomograph
-
Delay Line Nomogram -
Voltage, Current, Resistance, and Power Nomograph -
Resistor Selection Nomogram -
Resistance and Capacitance Nomograph -
Capacitance Nomograph -
Earth
Curvature Nomograph -
Coil Winding Nomogram -
RC Time-Constant Nomogram -
Coil Design
Nomograph -
Voltage, Power, and Decibel Nomograph -
Coil Inductance Nomograph -
Antenna Gain Nomograph
-
Resistance and Reactance Nomograph -
Frequency / Reactance Nomograph
|