April 1932 Radio News
 [Table
of Contents] [Table
of Contents]
Wax nostalgic about and learn from the history of early
electronics. See articles from
Radio & Television News, published 1919-1959. All copyrights hereby
acknowledged.
|
Using charts and nomographs to solve
calculations is not as common in today's world of portable high-powered computers
as it was when computers used vacuum tubes or even mechanical gears. One exception
might be the Smith chart, especially in the lab or field. You can plug numbers into
a programmable calculator or tablet app, but having the solution presented in the
form of a number gives you only that - a number. That's usually good enough, but
if you are doing troubleshooting or tweaking a design, being able to see how the
value got to be what it is by seeing what's around it can be very helpful. The Smith
chart is a particularly good example when watching the complex impedance point move
around. The more experience you have, the less you need such devices, but newbies
can really benefit from charts. This article presents a chart (nomograph) that facilitates
calculating two resistors or inductors in parallel, or two capacitors in series
according to the 1/XT = 1/X1 + 1/ X2.
Modern Radio Practice in Using Graphs and Charts
Part Four (see
Part 9)
Calculations in radio design work usually can be reduced to formulas represented
as charts which permit the solution of mathematical problems without mental effort.
This series of articles presents a number of useful charts and explains how others
can be made
By John M. Borst
A chart for the calculation of the total resistance of two branches or the total
capacity of a series is so simple, convenient and easy to make that the author has
never been able to understand why it is not used more. In contrast to the chart
which was described last month there is nothing difficult about this one. Ordinary
decimal scales are used and the calibrations as well as the angles are easily found.
The formulas for the solution of our problems are
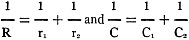
The similarity of these two equations makes the chart suitable for the solution
of either one of them. All we say in regard to one equation or its solution is equally
applicable to the other one.
In the February, 1932, issue of RADIO NEWS it was shown that this type of equation
could be solved with the aid of an alignment chart consisting of three scales converging
at one point. If the two angles formed at this point are equal and of 60 degrees,
then the same size unit can be used throughout. It is not always convenient to make
the angles of 60 degrees for a rather wide sheet of paper becomes necessary.
Fortunately, the two angles can be "anything." If the angle is a, then the modulus
of the slanting scales should be

where Mx is the modulus of the center
scale.
When cross-section paper is used, the divisions are already present; it is only
necessary to draw the three lines.
It will be seen that in the case of a large resistor, shunted by a small one,
the ruler, laid across the chart for the reading of the total, will make a very
sharp angle with all three scales and consequently the accuracy is not so good.
This can be obviated by making another chart with unequal angles for this kind of
solution. The relation still holds when the angles are unequal. This is proven at
the end of this article.
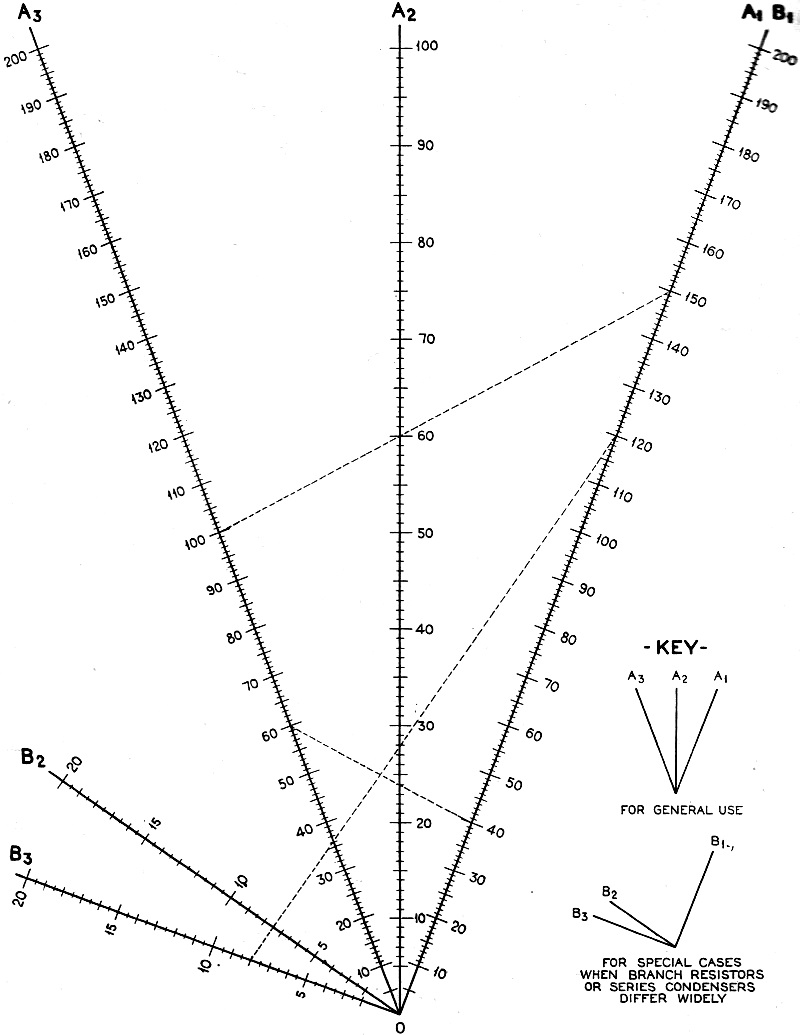
The two types of charts have been united and you find them both in Figure 1.
The scales marked A belong to the equal-angle chart and are intended for the solution
of the average problem. The scales marked B form the scale of the unequal-angle
type. When the two resistors in the problem are widely different, this is the chart
to use.
If the range is not large enough for a particular problem, all values on the
three scales can be multiplied or divided by any number.

Chart Solves Resistance and Capacity Problems
Problem 1. Let it be required to find what is the resistance
equivalent to 100 ohms and 150 ohms in parallel. A transparent ruler laid across
the chart so that it connects 100 on one slanting scale and 150 on the other, crosses
the center line at 60. This is the resistance sought.
Problem 2. Suppose there were three resistors in parallel, for
instance, 150, 100 and 40 ohms. In this case, first determine the resistance of
two branches in parallel, say 100 and 150; our problem No.1. Then the equivalent
resistance, 60 ohms, is in parallel with 40 ohms and the chart is used a second
time. Draw a line from 60 on one slanting scale to 40 on the other and find, in
the center, the intersection at 24. This is the resistance of the three branches
in parallel.
Problem 3. What is the capacity of 120 and 8 micro-microfarads
in series? Since here the two condensers are so widely different, it is best to
use chart B. A line drawn from 120 on the right slanting scale to 8 on the extreme
left scale crosses B2 at 7.6 micro-microfarads approximately. This is the capacity
of the combination-smaller than the smallest.
Figure 1. This chart and a ruler are all that you need for
the solution of total resistance of resistor branches and for the solution of total
capacity for condensers in series
It is of course necessary to read the same units on all scales. They should be
all micro-microfarads or all micro-farads for one particular problem.
Some equations, frequently used in optics, are of the same form as those here
treated and therefore can be solved with the aid of the same chart.
The well-known formula, giving the relation between focal length of a lens and
the distances of image and object, is

where f is the focal distance, i the image distance and o the object distance.
Read f on the middle scales: A2 or B2.
 A second one is the formula for the focal length of a system of two or more lenses. A second one is the formula for the focal length of a system of two or more lenses.

where F is the focal length of the system and f1 f2are the focal lengths of the individual
lenses making up the system. In this case F is to be read on the middle scale.
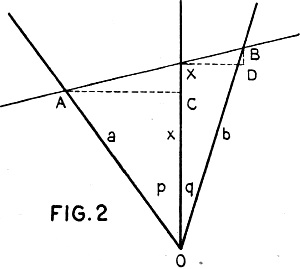
In Figure 2 are shown three scales converging
at one point and with the angles p and q unequal. It is required to find the relation
between the segments OA, OX and OB when A, X and B are on a straight line.
The solution is found in the same way as in previous examples, in the March and
February issues of RADIO NEWS.
Draw the two rectangular triangles ACX and XDB. Since these triangles are similar,
we can write
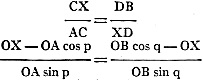
 Removing fractions: Removing fractions:
OB.OX sin q - OA.OB cos p sin q
= OA.OB sin p cos q - OA.OX sin p
Solving for OX:
OX (OA sin p + OB sin q)
= OA.OB (cos q sin p + cos p sin q)
or
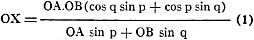
From trigonometry: cos q sin p + cos p sin q = sin (p+q). Substituting this in
the equation (1) and writing it in the desired form:
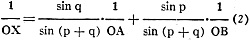
 When the modulus on the three scales is also taken in consideration, OX, OA and
OB must be replaced by their respective values When the modulus on the three scales is also taken in consideration, OX, OA and
OB must be replaced by their respective values
xMx, aMa and bMb
The formula then becomes


Geometrical Construction
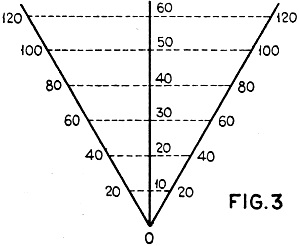
Figure 3 shows the principle of constructing the symmetrical chart. A constructional
line drawn through division 50 on the center scale and perpendicular to it, intersects
both slanting scales at division 100. All other lines, parallel to it, pass through
divisions on the slanting scales which indicate twice that of the one in the center.
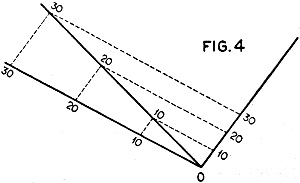
In the case of a non-symmetrical scale, the construction is made as in Figure
4. The constructional lines form parallelograms and the numbers are the same at
three angles.
These constructions are easy to understand, for in each case they are really
sample calculations as we described last month, under the subhead, "The Automatic
Method."
Nomographs / Nomograms Available on RF Cafe:
-
Parallel Series Resistance Calculator -
Transformer Turns Ratio Nomogram -
Symmetrical T and H Attenuator Nomograph -
Amplifier Gain Nomograph -
Decibel
Nomograph -
Voltage and Power Level Nomograph -
Nomograph Construction -
Nomogram Construction for Charts with Complicating Factors or Constants
-
Link Coupling Nomogram -
Multi-Layer Coil Nomograph
-
Delay Line Nomogram -
Voltage, Current, Resistance, and Power Nomograph -
Resistor Selection Nomogram -
Resistance and Capacitance Nomograph -
Capacitance Nomograph -
Earth
Curvature Nomograph -
Coil Winding Nomogram -
RC Time-Constant Nomogram -
Coil Design
Nomograph -
Voltage, Power, and Decibel Nomograph -
Coil Inductance Nomograph -
Antenna Gain Nomograph
-
Resistance and Reactance Nomograph -
Frequency / Reactance Nomograph
Posted December 21, 2021
(updated from original post on 10/4/2013)
|