|
Remember the test patterns
that used to be broadcast by over-the-air broadcast stations that were used to align
the electron beam defection circuitry in CRT-based televisions? That pattern of
squares, circles, parallel and radial lines was generated by a special tube called
a "Monoscope" (RCA 2F21) on the transmitter end. Focus, 4:3 picture aspect ratio,
linearity, frequency response, and contrast and brightness were all tweaked to optimize
the pattern on the TV receiver circuitry. Of course not all sets were capable of
obtaining a perfect alignment due to inferior design and/or a scheme by the manufacturer
to provide a lower cost model with the tradeoff being a poorer picture - that was
the type of TV we always had in my household as a kid (and today for that matter).
As a side note, can you imagine the heck that would be raised if an
Indian
chief's head were to be used today in a test pattern?
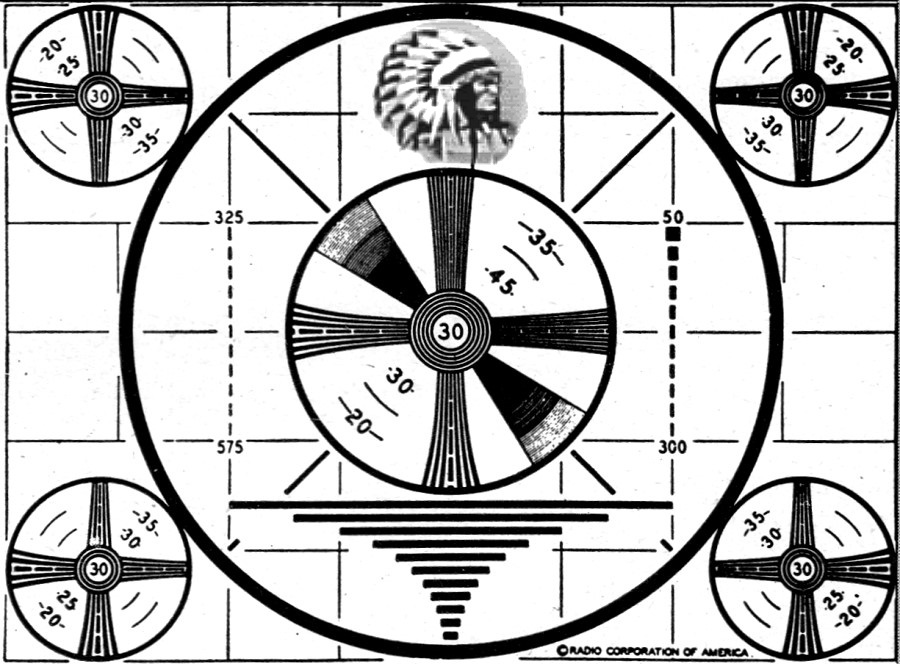
The Television Test Pattern
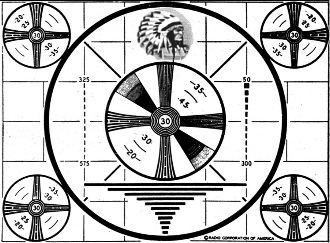
Fig. 1 - "Indian Head" test pattern used by many television
stations.
By M. S. Kay
The test pattern has been designed to convey important performance data. Study
it carefully.
Every television station, prior to its actual broadcasting period, transmits
a test pattern for the purpose of permitting set owners to adjust their receiver
controls for optimum reception. In addition, many stations set aside 3 to 4 hours
during the day - generally the morning and afternoon - during which they transmit
nothing but a test pattern accompanied either by a 400 cycle audio note or music.
The purpose of this transmission is to enable television servicemen to install and/or
repair television receivers. Without such aid, television work would be confined
only to those relatively few evening hours when the stations are on the air. While
equipment is becoming available now which will permit adequate television service
work without the need of a transmitter on the air, no such simple solution is in
sight for television receiver installations. Only a signal received from a station,
as normally transmitted under actual operating conditions, can be of any assistance
in properly orienting the television antenna.
Television test patterns assume many forms, but the one in most common use today
is that shown in Fig. 1. This pattern is produced by the RCA "Monoscope" tube,
2F21, from a plate built into the tube. When the station is transmitting this test
pattern, the "Monoscope" supplies the complete signal in place of the television
camera tube.
With the aid of these test patterns, the television serviceman can check the
adjustment of the following items concerning a television receiver: 1. Focus Setting;
2. Aspect Ratio; 3. Linearity Adjustment; 4. Frequency Response; 5. Shading and
Contrast; 6. Interlacing.
1. Focus: Focusing of the image is probably the simplest operation
of all. It consists merely in rotating the focus potentiometer until the various
sections of the test pattern stand out sharp and clear. On either side of the correct
focus control setting, the image will become blurred and fuzzy. Some receivers achieve
focusing control by permitting adjustments to be made on the physical positioning
of the focus coil along the neck of the cathode-ray tube. These adjustments are
generally screwdriver adjustments and must be made from the back of the receiver.
When one man is working alone on a set, the only way that he can see what is appearing
on the screen is through the use of a mirror, placed facing the screen and tilted
slightly upward.
2. Aspect Ratio: The aspect ratio is the ratio of the image
width to the image height and in modern television has been standardized at 4 to
3. This means that the width is one and one-third times greater than the height.
On the test pattern, Fig. 1, the large circle has a diameter which represents
the three in the aspect ratio. In other words, it is three-fourths of the image
width. The picture appearing on the television receiver screen should be adjusted
until the upper and lower portions of the large circle are touching the top and
bottom edges, respectively, of the screen mask. The width of the image is then increased
until the four smaller circles are each in one corner of the screen. Note that the
background of squares in the image also indicates the aspect ratio. There are eight
horizontal squares across the image to six vertical squares. 8 divided by 6 equals
4 over 3.

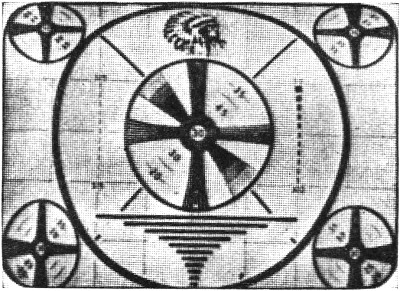
Fig. 2 - An example of vertical non-linearity in a test
pattern. Note how compressed the Indian Head is whereas the bottom third of the
pattern image is "stretched out."
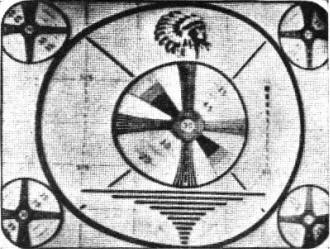
Fig. 3 - Example of horizontal non-linearity.
3. Linearity: To check the proper setting of the vertical and
horizontal linearity controls, examine the central circles in the image. If they
are egg-shaped, the beam is not traveling at a uniform speed over the screen. Vertical
non-linearity is indicated by the circle being "egg-shaped" in the vertical direction.
See Fig. 2. By the same token, horizontal non-linearity is indicated by having
the circle "egg-shaped" in the horizontal direction (Fig. 3). Whichever control
is affected should be adjusted until the circles become circular again. (Note: It
frequently happens that after this adjustment has been satisfactorily made for one
station, that the same test pattern for one or more of the other local stations
will be slightly egg-shaped. This is due to non-linearity in the scanning equipment
at the broadcast station. The only thing the serviceman can do is to set the receiver
linearity controls to some compromise position. Fortunately, with transmitted programs,
slight non-linearity is seldom noticeable.)
4. Frequency Response: The frequency response of a television
receiver is one of its most critical features and determines how well an image will
be resolved. Of particular importance is the extent of the low and high ends of
this response and a careful check of the test pattern will indicate whether the
system is fully compensated at each of these ends.
High-Frequency Response. High-frequency response of the receiver can be judged
by examination of the four wedges at the center of the test pattern. The numbers
close to the wedges (i.e., 20, 30, 35, and 45) stand, respectively, for 200, 300,
350, and 450 line resolution. Between each of these numbers is a line which stands
for the middle value. Thus, the line between 20 and 30 stands for 25, and the line
between 35 and 45 is for 40. At the center, the number 30 means 300 lines. The word
"line" refers to the number of lines that could be accommodated within the vertical
height of the pattern. The frequency at which the system cuts off is indicated in
the wedges at the point where the lines blend together and are no longer visible
separately and distinctly. Thus, in most receivers, the lines run together between
30 and 40. In a poorly designed set, the lines may blend at 25. The circles in each
corner also contain wedges with numerical line markings. However, the resolution
of these circles is made less than the resolution of the center circles because
the beam is not capable of being as sharply focused at the sides of the screen as
it is in the center.
The wedges are formed with the black and white lines having the same width if
measured along a line normal to the wedge centerline at that point. It will be noted
that the two horizontal wedges are identical to the two vertical wedges. This permits
us to check both the horizontal and vertical resolutions of the system. The horizontal
wedges are used to determine vertical resolution and the vertical wedges are used
to determine horizontal resolution. That this should be so is evident from the following
reasoning. Vertical resolution, for example, is dependent upon the closeness with
which lines can be placed above each other. In the horizontal wedges, the lines
are placed one above the other, with the spacing between them varying at various
points along the horizontal wedges. When the lines are no longer distinguishable
from each other, we have reached the limit of the vertical resolution. By the same
token, the vertical wedges indicate how closely lines or details can be placed next
to each other horizontally. When the system is no longer able to resolve these pinpoint
white and black lines, they become indistinguishable and the limiting resolution
has been reached.
In a television receiver, the vertical resolution is almost entirely a function
of the number of lines used, in this case, 525. Normally, the performance of the
receiver has little effect upon this vertical resolution unless the interlacing
is poor in which case other indications on the test pattern reveal this. (To be
explained in detail later.) The horizontal resolution, on the other hand, is dependent
upon the response and performance of the receiver r.f., i.f. and video-frequency
stages and this is important to the serviceman. Hence, the vertical wedges are examined
to determine- where the lines blend and the reading at this point is recorded as
so many lines, say 300. This means that up to the number 30 in the test pattern
the lines are separate and distinct but beyond this they run together. Through experience,
most servicemen know that a resolution of 300 lines is close to a 4.0 mc. bandpass
in the receiver, but they possess no accurate method of determining the system response
for other values of line resolution. With the following formula, the conversion
from the number of lines to frequency response can be readily achieved.
Freq. (cycles) = 12,500 x N
Where: N = number of lines as read from the test pattern. For example, if the
lines merge at 300 lines, the receiver response is: Freq. = 12,500 x 300 = 3,750,000
cycles = 3.75 mc.
When the receiver system is over-compensated at, the high frequencies, so that
a definite peak results, then a process known as "ringing" will take place. We check
for "ringing" with the two columns of single rectangular areas located on either
side of the inner circle. The numbers (50, 300, 325, and 575) indicate the width
of the nearest rectangle, the width being given as the number of lines which could
be accommodated vertically in the image. If over-compensation or "ringing" is present,
the rectangles will be followed on the screen by multiple rectangles somewhat similar
to ghost images, but evenly spaced from each other. This can be explained as follows.
When a signal containing high-frequency components is applied to this system,
the effect, if sudden enough, will produce a series of high-frequency oscillations.
These oscillations generally die out rapidly, but before they do, they place several
small lines on the screen, each evenly spaced from the original sharp line (or rectangle)
that produced them. The lines are produced by the negative peaks of each oscillatory
cycle. Not all the oscillations produce visible marks on the screen. Generally only
the first two or three are able to do this, depending on the extent of the over-compensation.
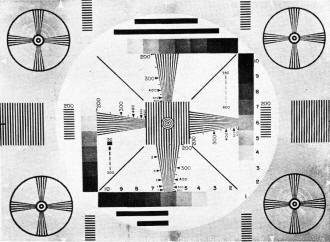
Fig. 4 - A comprehensive test pattern designed for checking
television transmitter response and operation. This is the standard RMA chart.
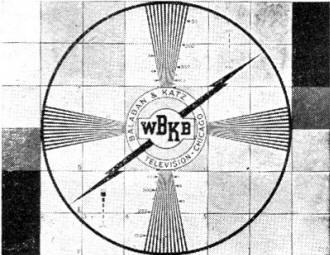
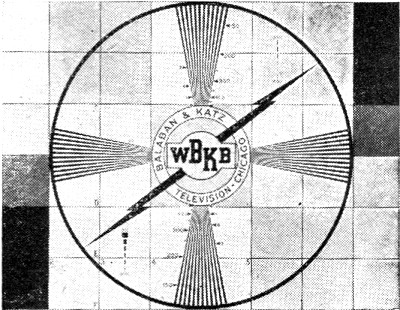
Fig. 5 - Station test pattern of WBKB, Chicago
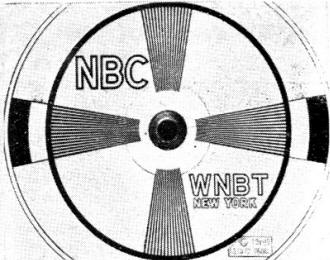
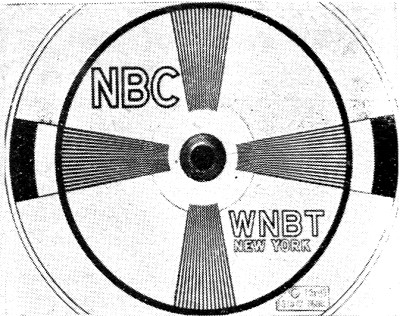
Fig. 6 - Station test pattern of WNBT, New York.

A General Electric television camera in action with its crew
at the U. S. Navy Special Devices Center at Sands Point, Long Island, where the
Navy is performing experiments in mass training of personnel by means of telecast
lectures and equipment demonstrations.
When only slight over-peaking is present, it can be detected by examining the
black horizontal bars at the bottom of the image. At the left-hand edge of these
bars, the margin will be excessively black whereas at the right-hand edge, there
will be a short excessively white margin following these bars. The total effect
is to outline the bars, and to make them more sharply defined. Some servicemen are
in favor of slight high-frequency over-compensation because they feel that a sharper,
crisper image is obtained. However, if this procedure is followed, it should be
done cautiously lest excessive over-compensation and "ringing" be produced.
Low-Frequency Response. The eleven black horizontal black bars located at the
bottom of the test pattern are for the purpose of checking the low-frequency response.
When the system has poor low-frequency response, the reproduced edges of the horizontal
bars will be sharply defined, but will change from black to an excessive white,
with a streamer shading from this white back to the normal background. The visual
effect is one of smearing, with the smearing going from left to right because that
is the path of travel of the electron beam. Poor low-frequency response is generally
accompanied by excessive phase shift and it is difficult to distinguish between
the two. For the serviceman, however, the appearance of the smearing means that
the low-end of the system's response curve is at fault and must be corrected.
5. Contrast and Shading: To check the over-all contrast of the
test pattern, we have the Indian Head at the top of the center portion of the test
pattern. The contrast control should be set so that the head appears pleasantly
shaded, being neither so dark that the various shades of white and grey are obscured
or so light that the entire image has a filmy, washed-out appearance. As a further
aid in checking the receiver contrast range, the remaining two oblique wedges in
the test pattern have four different tonal ranges. The innermost section of each
wedge is black, with each additional wedge possessing Ii lighter shade of grey.
If the transmitter and receiver are both operating normally, then each of the four
shading steps should be distinctly separable on the test pattern. If the received
pattern does not indicate these four graduations, either the transmitter or the
receiver is at fault - the fault in this case being non-linear amplitude distortion
of the video amplifiers. Where more than one station is operating locally, check
with each station to determine whether their patterns show the proper shading. If
all stations appear to have a poor shading in their test patterns then it is safe
to assume that the trouble lies within the receiver since it is highly improbable
that two or more stations, operating independently, would exhibit the same difficulty.
However, if only one station presents a poor shading pattern, while the other test
patterns are normal, then the defect lies with the transmitter. To the serviceman,
the defect is important only when it arises in the receiver. The trouble, when it
is here, can be traced to an improperly biased video-frequency amplifier or a gassy
tube in this system.
6. Interlacing: There is one final test that can be made with
this test chart and this is to determine whether the odd numbered lines are falling
properly between the even numbered lines. If, for any reason, the vertical sweep
oscillator is not operating properly, the lines of one field will not accurately
drop into the spaces between the lines of the previous field. Lines of one field
may fall close to or even directly over the lines of the previous field, in which
case there is a loss in detail due to this partial pairing of lines. In the test
pattern, we check the quality of interlace by examining the narrow diagonal lines
in the center portion of the chart. Partial interlacing, which means incomplete
interlacing, will be evident by the jagged reproduction of these lines. When there
is a complete pairing of lines, or a complete absence of interlacing, then the test
fails. In this case, however, the pairing is generally quite easily visible by noting
the wide separation between the lines. Since the defect is due to an improperly
functioning vertical sweep system, this should be checked.
A distinction should be made here between the reduction in vertical resolution
due to incomplete interlacing and the same reduction arising from a limited frequency
response. A limited frequency response will not cause the diagonal lines to become
jagged, whereas poor interlacing will.
The foregoing discussion is designed to indicate the usefulness of test patterns
to television receiver servicemen. More extensive test patterns are employed in
the checking of television transmitters because of the greater number of adjustments
that must be made in this equipment. A standard transmitter pattern developed by
the RMA Committee on Television Transmitters is shown in Fig. 4. Finally there
are individual test patterns developed by each station bearing a few of the markings
(in one form or another) contained in the RCA "noscope" pattern and in addition,
giving the station call letters. Two such patterns are shown in Figs. 5 and 6.
Posted October 12, 2022
(updated from original post
on 9/11/2015)
Color and Monochrome (B&W) Television
Articles
|