|
|||||||||||||
 |
|||||||||||||
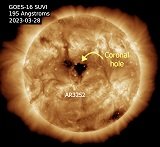
Coronal Hole |
|||||||||||||
|
Electronics & Technology
The physics behind coronal holes is closely linked to the Sun's magnetic field. The Sun's magnetic field is generated by the motion of charged particles within the Sun's interior, and is closely tied to the rotation of the Sun. The magnetic field lines on the Sun are constantly in motion, and can become twisted and tangled over time. When these magnetic field lines become particularly twisted, they can release energy in the form of a solar flare or coronal mass ejection. In some cases, the magnetic field lines can become so twisted that they break through the surface of the Sun and extend out into space. These areas are known as coronal holes. The hot plasma in the corona is able to escape along these open magnetic field lines, resulting in a region of low-density plasma and high-speed solar wind. The formation of coronal holes is closely linked to the 11-year solar cycle, which is driven by changes in the Sun's magnetic field. During periods of high solar activity, the magnetic field lines become more twisted and tangled, leading to a greater number of solar flares and coronal mass ejections. As the solar cycle reaches its minimum, the magnetic field lines become more organized and stable, resulting in the formation of coronal holes. In summary, coronal holes are regions on the Sun's corona where the magnetic field lines extend out into space, allowing the hot plasma to escape into the solar wind. The physics behind coronal holes is closely linked to the Sun's magnetic field, and is driven by changes in the magnetic field over the 11-year solar cycle.
AI Technical Trustability Update While working on an update to my RF Cafe Espresso Engineering Workbook project to add a couple calculators about FM sidebands (available soon). The good news is that AI provided excellent VBA code to generate a set of Bessel function plots. The bad news is when I asked for a table showing at which modulation indices sidebands 0 (carrier) through 5 vanish, none of the agents got it right. Some were really bad. The AI agents typically explain their reason and method correctly, then go on to produces bad results. Even after pointing out errors, subsequent results are still wrong. I do a lot of AI work and see this often, even with subscribing to professional versions. I ultimately generated the table myself. There is going to be a lot of inaccurate information out there based on unverified AI queries, so beware. Electronics & High Tech Companies | Electronics & Tech Publications | Electronics & Tech Pioneers | Electronics & Tech Principles | Tech Standards Groups & Industry Associations | Societal Influences on Technology |
|||||||||||||
 |
|||||||||||||
|
|||||||||||||


|
||||||||||||||||||||||||||||||||||||


